DORO CONCEPT · SELECTED PROJECTS · 2019–2026
Work that getsopened.
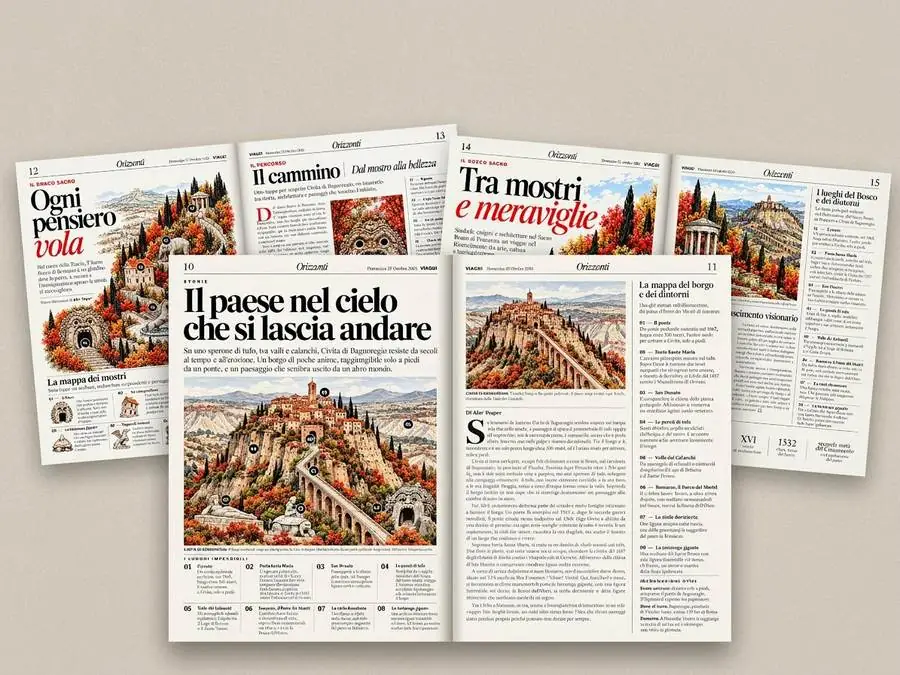
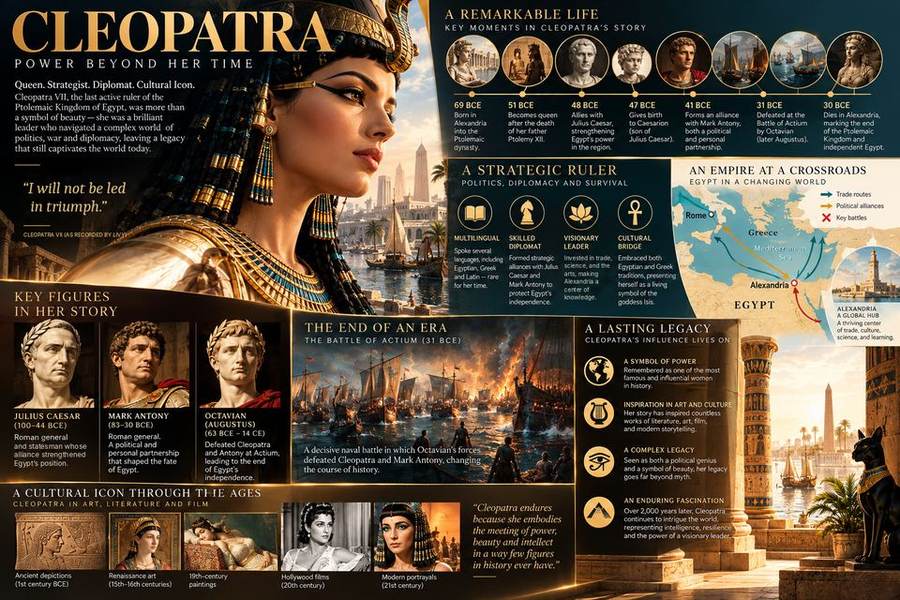
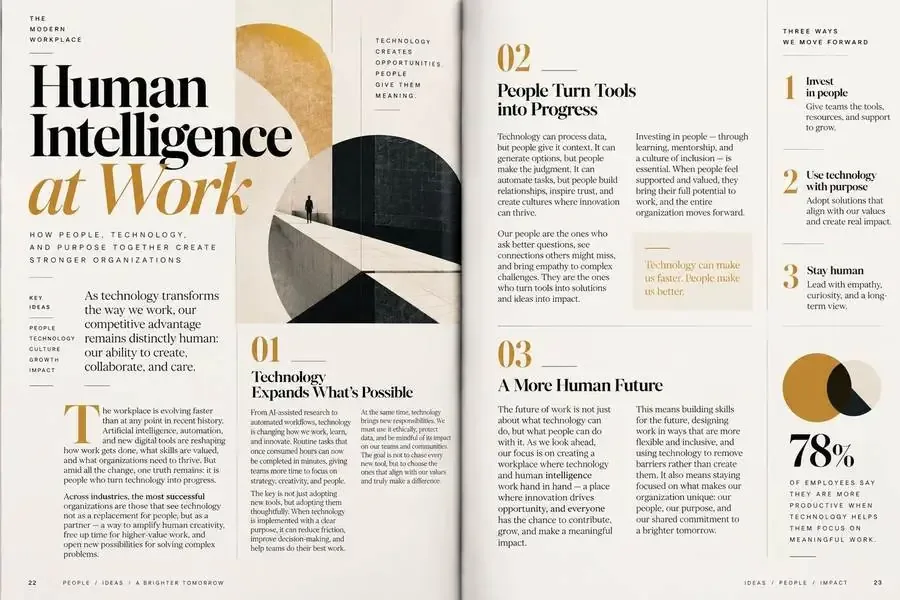
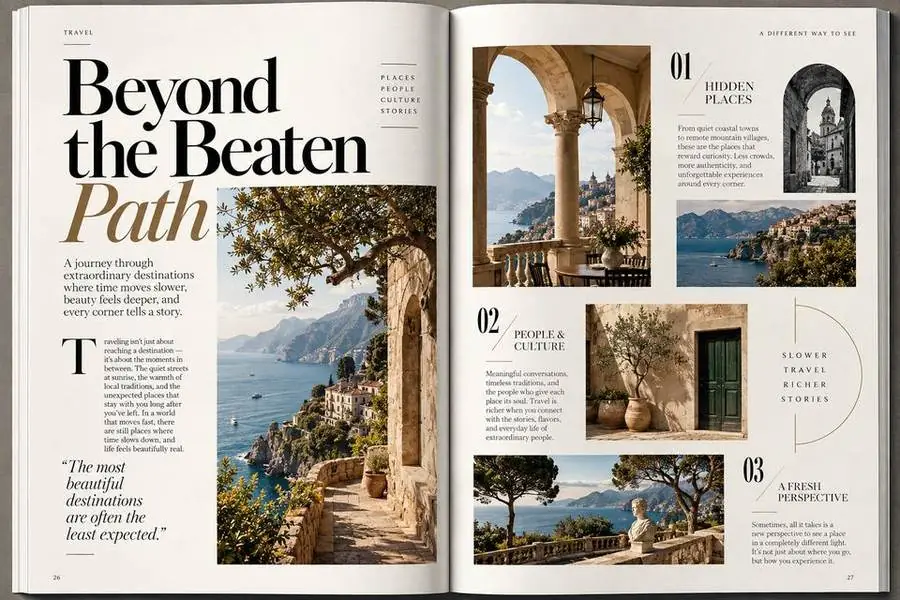
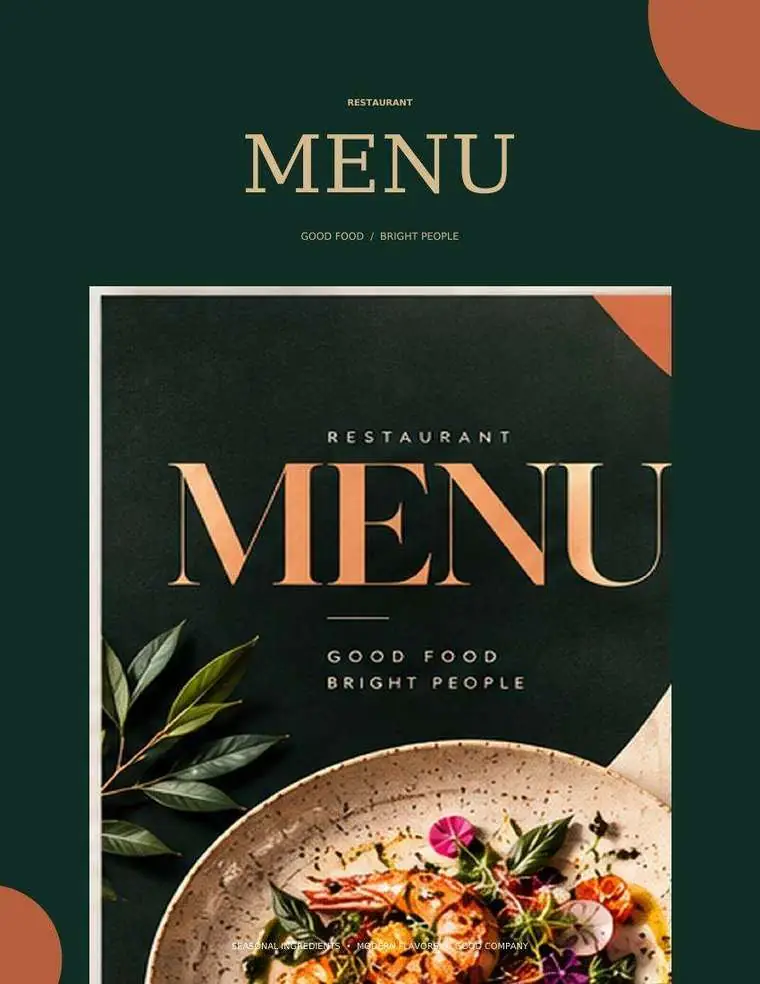
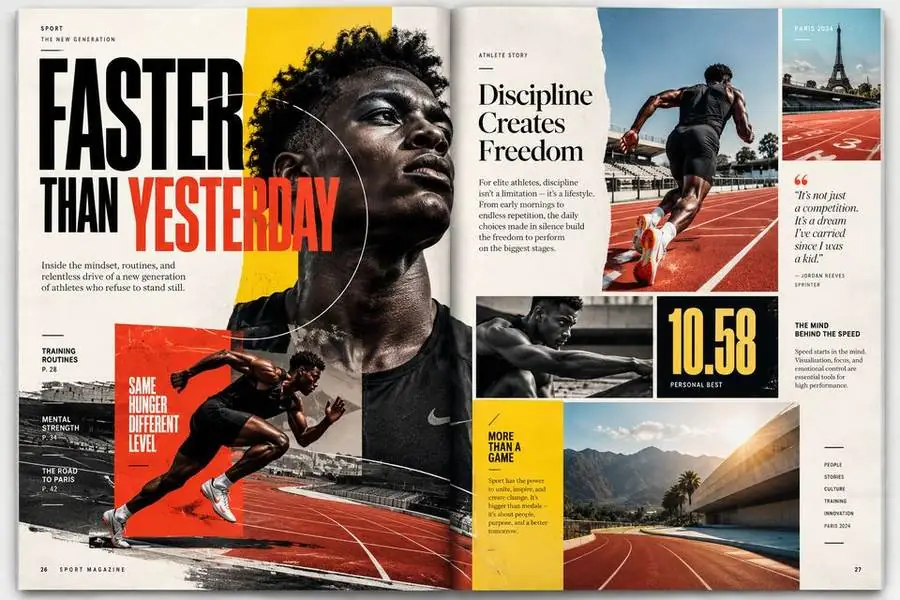
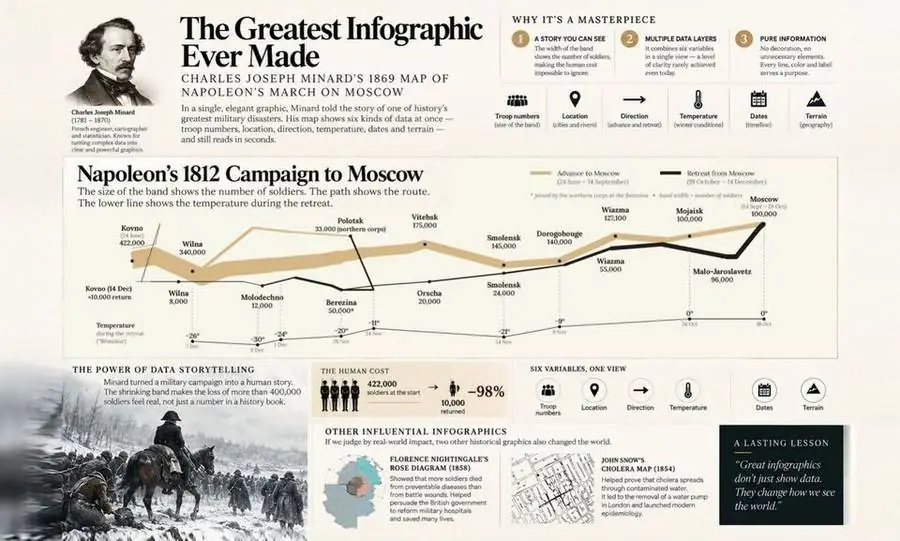
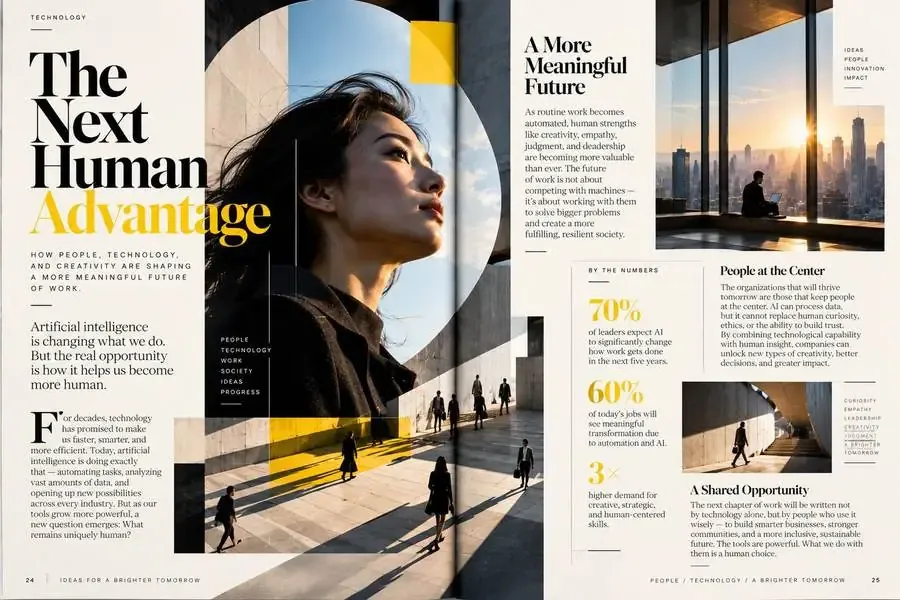
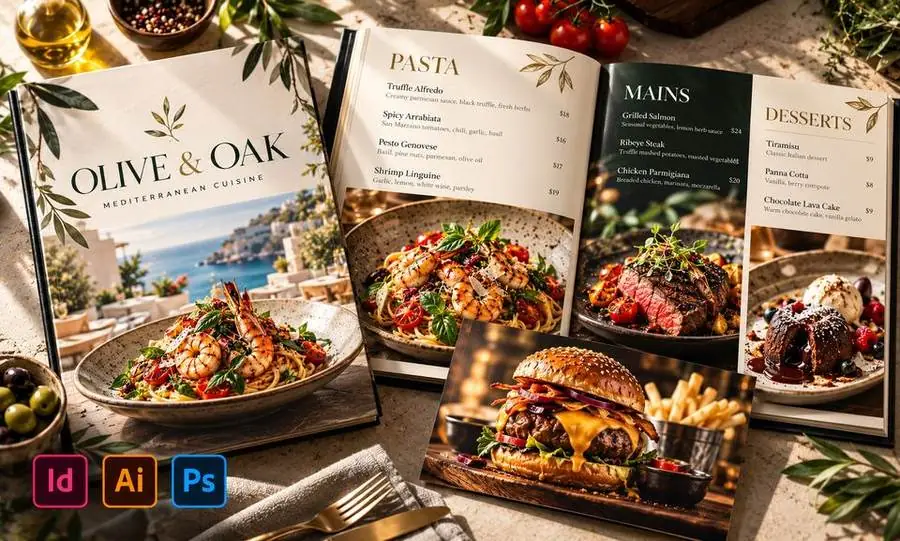
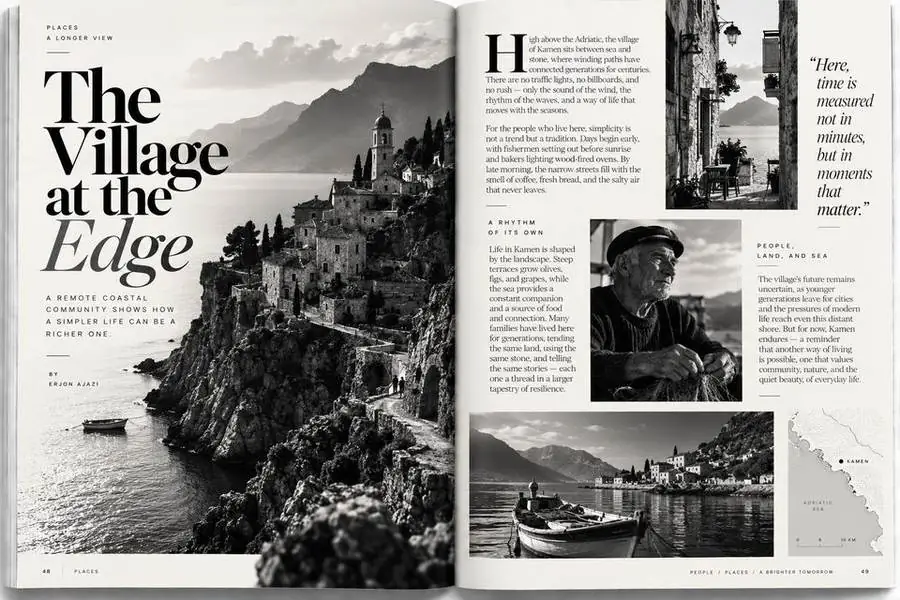
Interactive catalogs, magazines, newspapers, infographics, menus, games and websites. Choose a category, or browse everything.
SHOWING ALL 43 PROJECTS







HAVE A PROJECT IN MIND?
Let's make something people stop for.
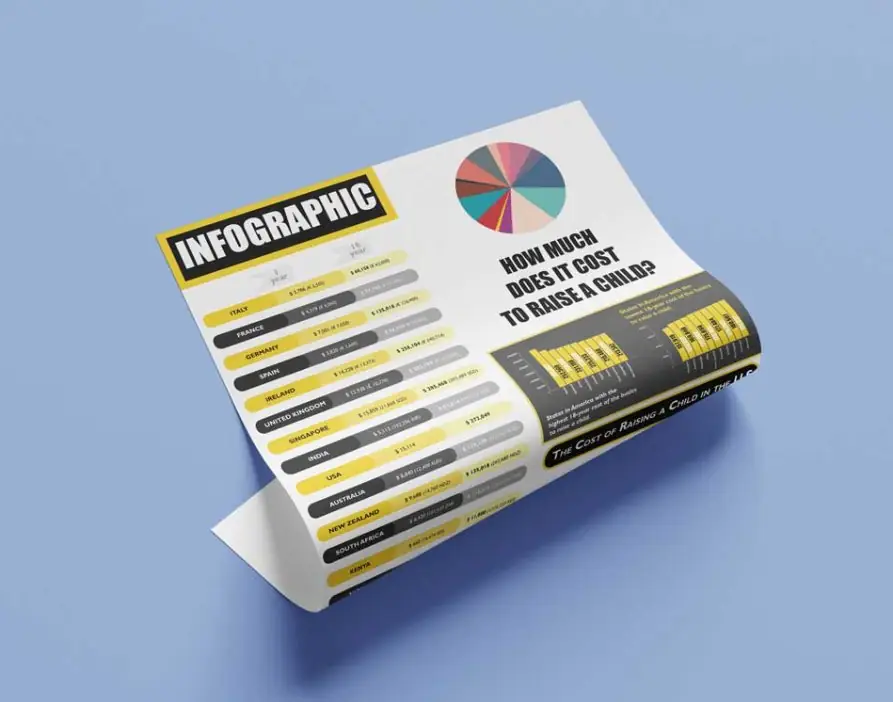
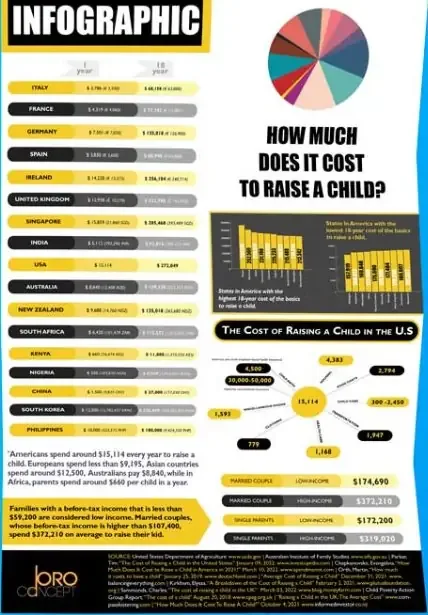
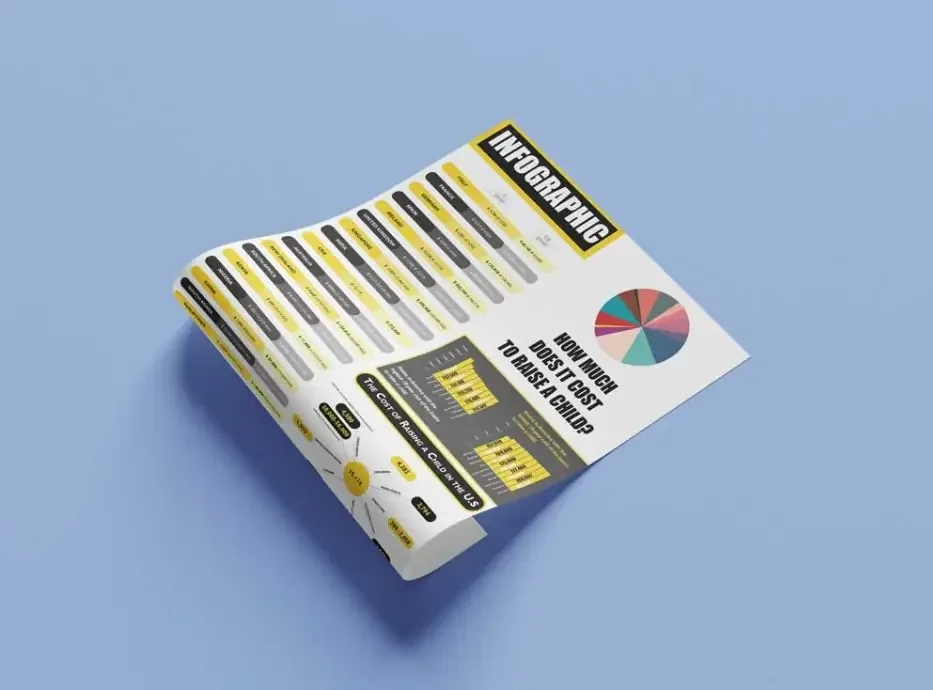
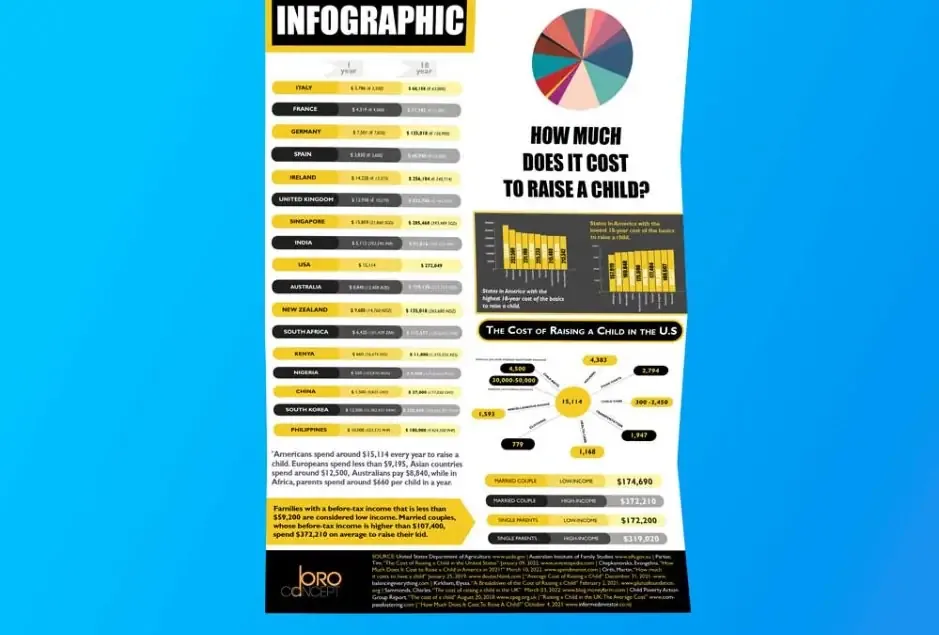
How much does it cost to raise a child?
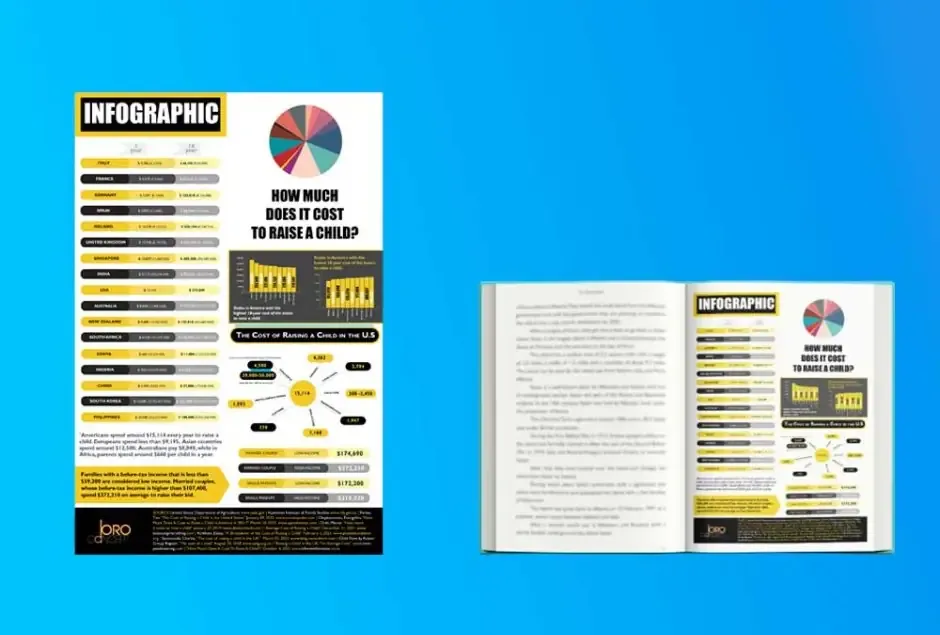
A one-page data infographic comparing the cost of raising a child across 17 countries, at one year and at eighteen, with a closer look at the United States.
THE HEADLINE NUMBER
THE COST OF RAISING A CHILD IN THE U.S.
Income changes everything.
Families with a before-tax income below $59,200 count as low income. Married couples earning above $107,400 spend $372,210 on average to raise their child.
THE FULL POSTER
17 countries, two timelines.
Every country sits on a yellow or charcoal pill, with the cost of the first year next to the cost of eighteen years, shown in US dollars and the local currency.
- Pie chart for the global split
- Bar charts for the US states with the highest and lowest costs
- Spending wheel breaking down the $15,114 a year
- Sources listed in full at the foot of the page
IN PRINT
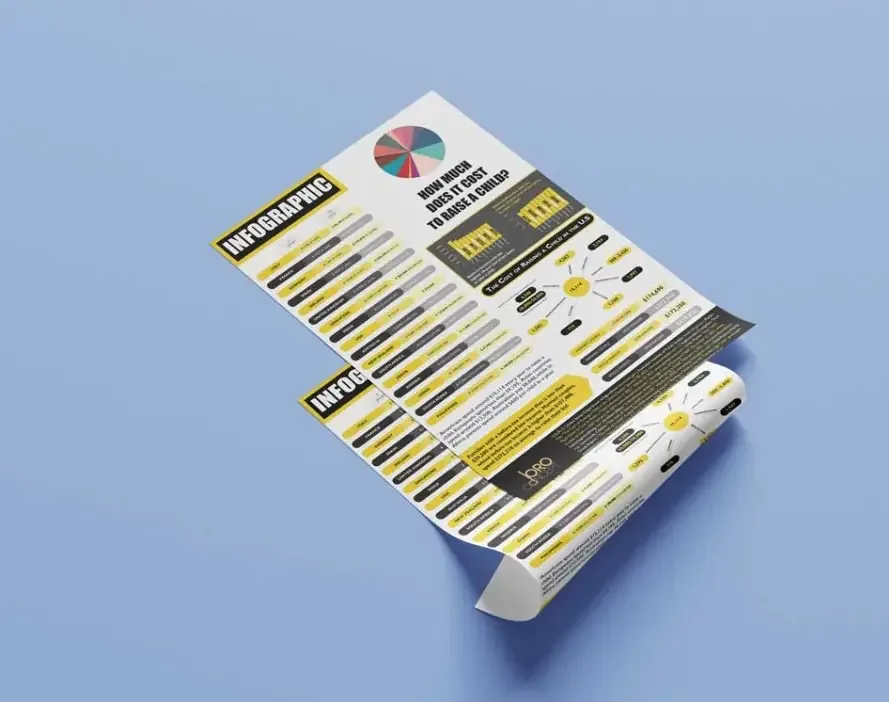
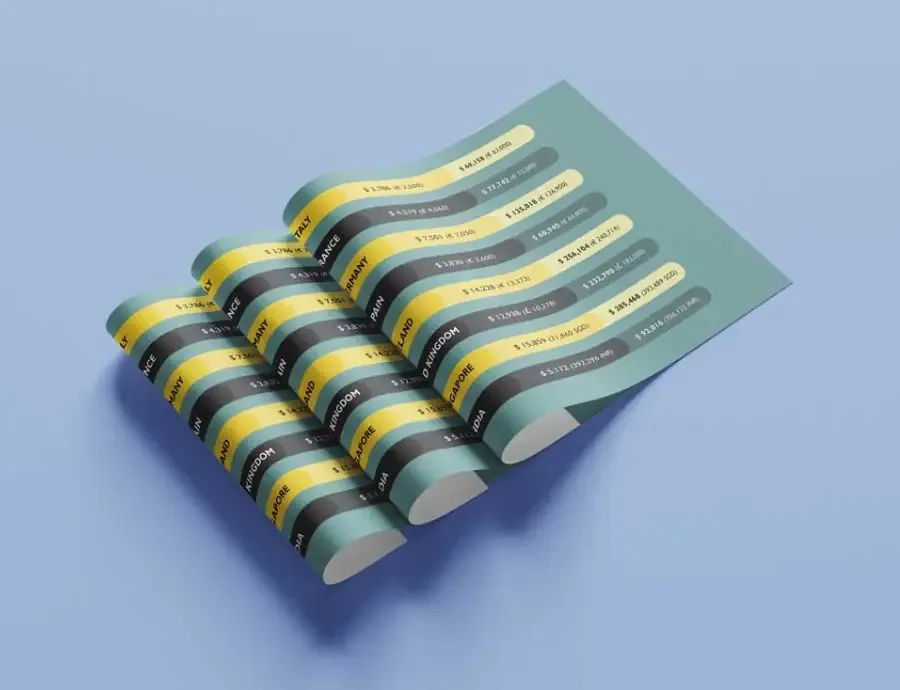
From screen to paper.
Got numbers that need a story?
Start an infographic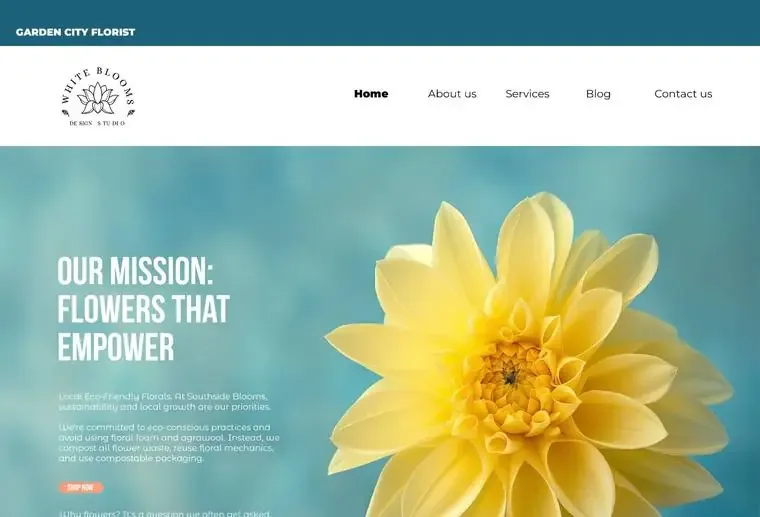
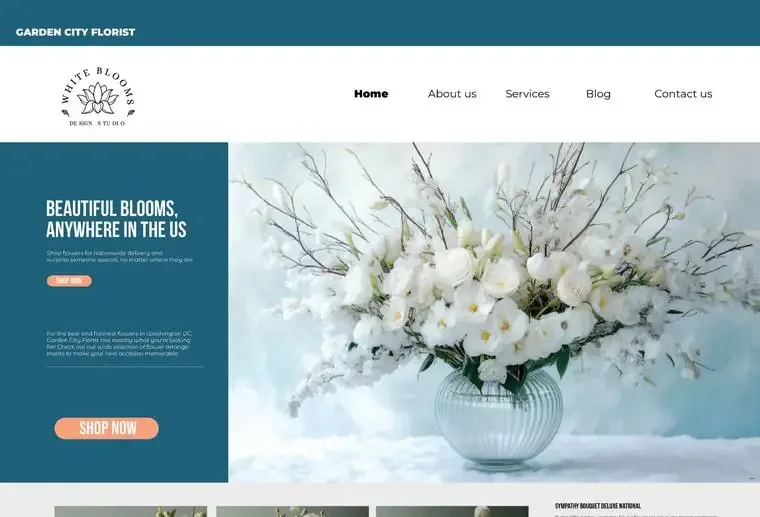
Florist · E-commerce concept
Garden City Florist
Blooms, delivered.



The pages
Desktop layouts · hover a window to scroll
NEXT MOCKUP
Pearl Gold Boutique Want one like this? Let’s talk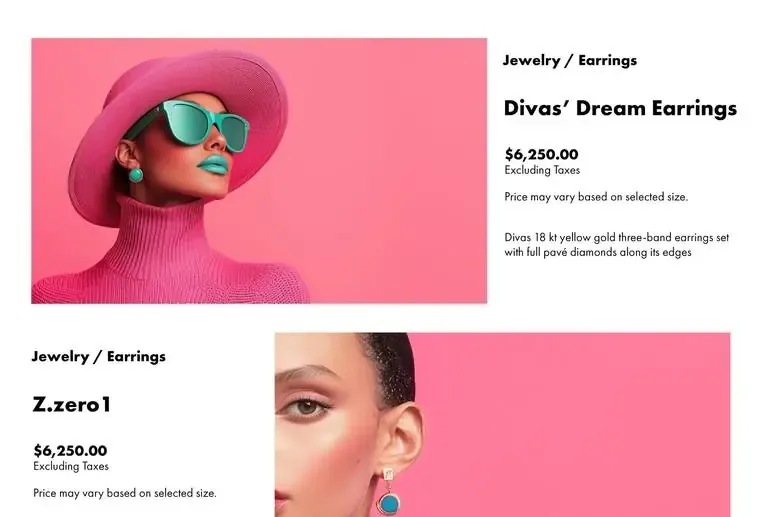
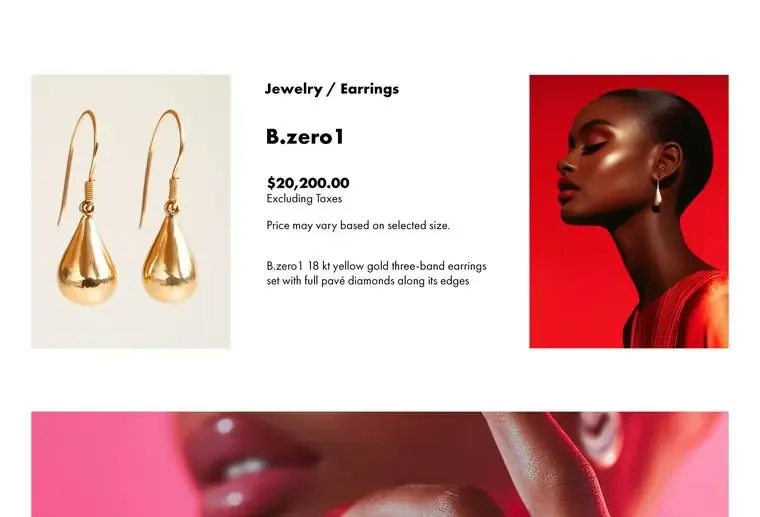
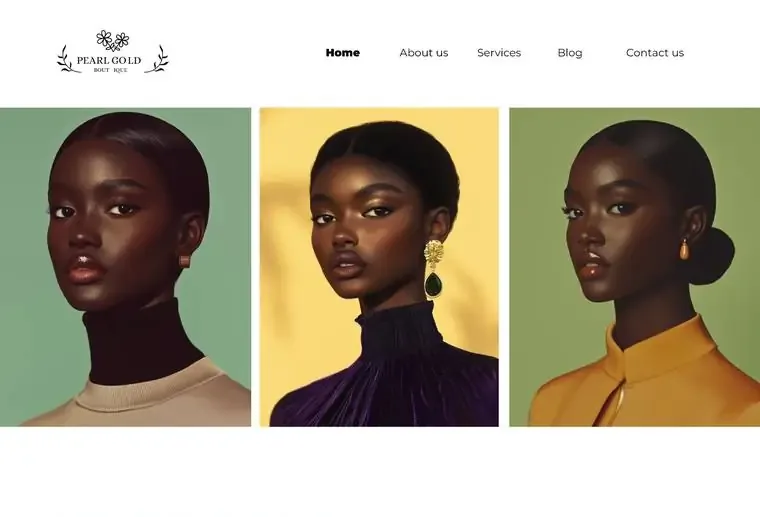
Luxury jewelry · E-commerce concept
Pearl Gold Boutique
Gold, in full colour.
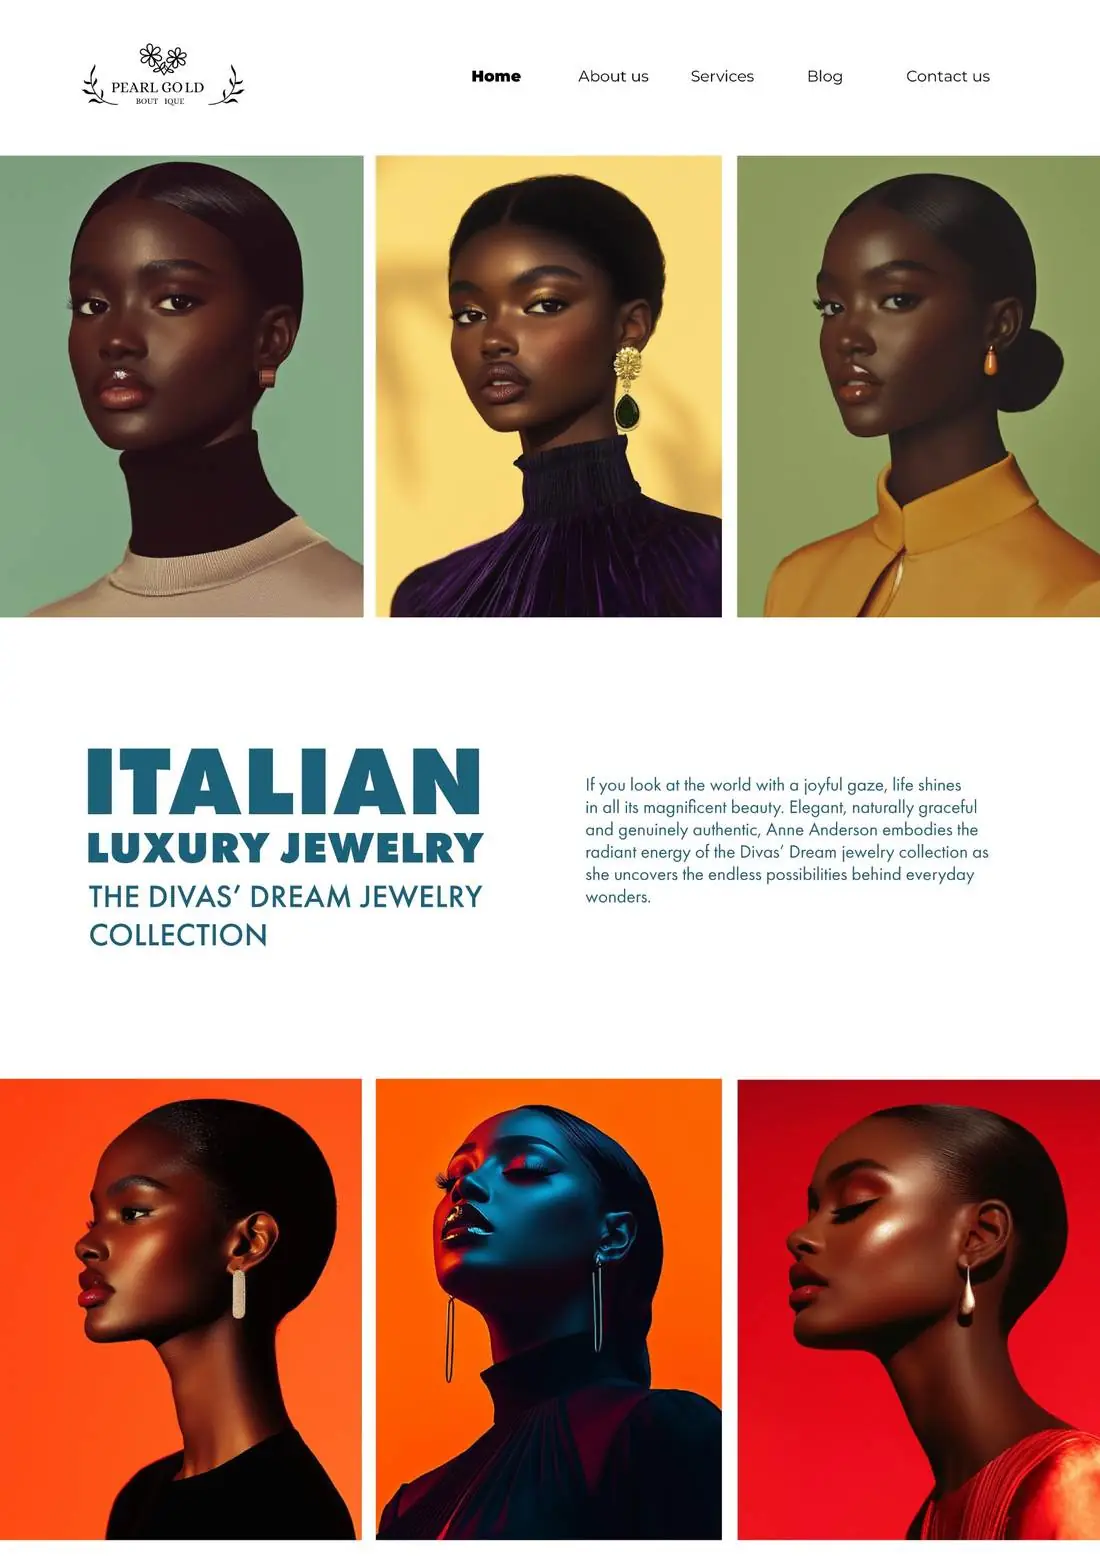
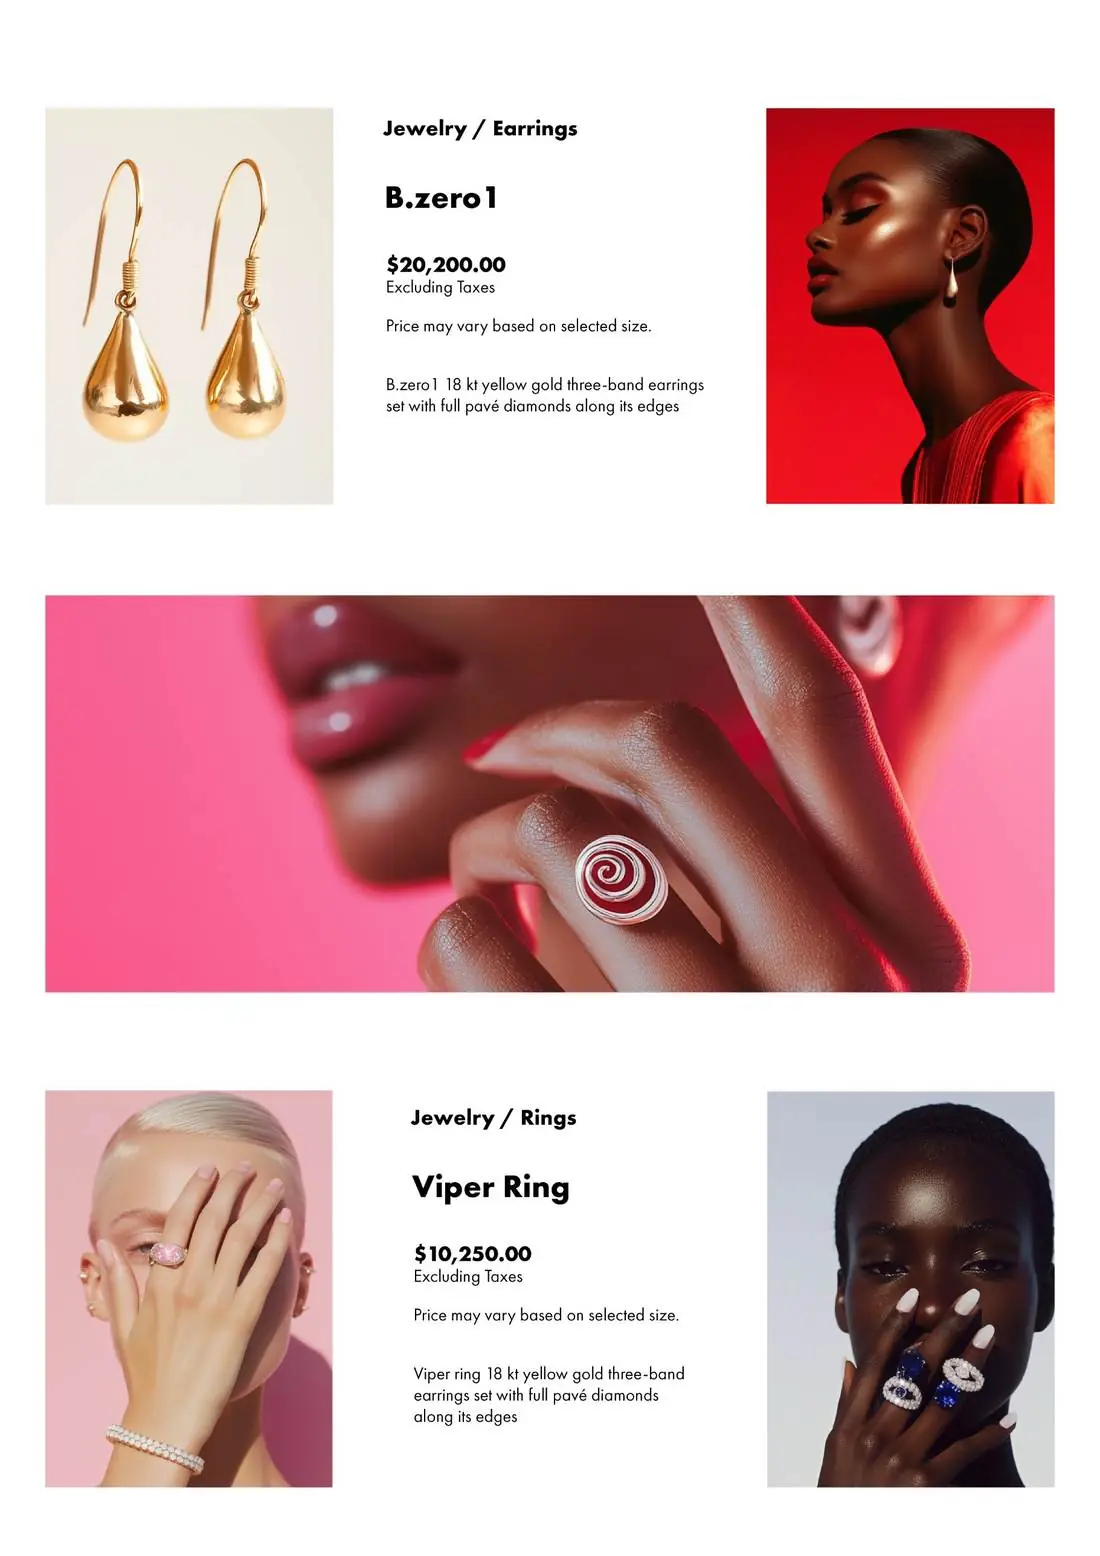

The pages
Desktop layouts · hover a window to scroll

NEXT MOCKUP
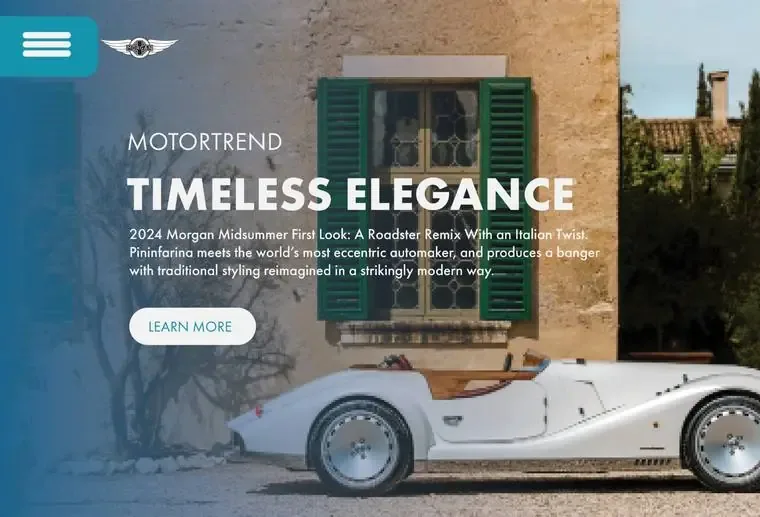
Timeless Elegance Want one like this? Let’s talk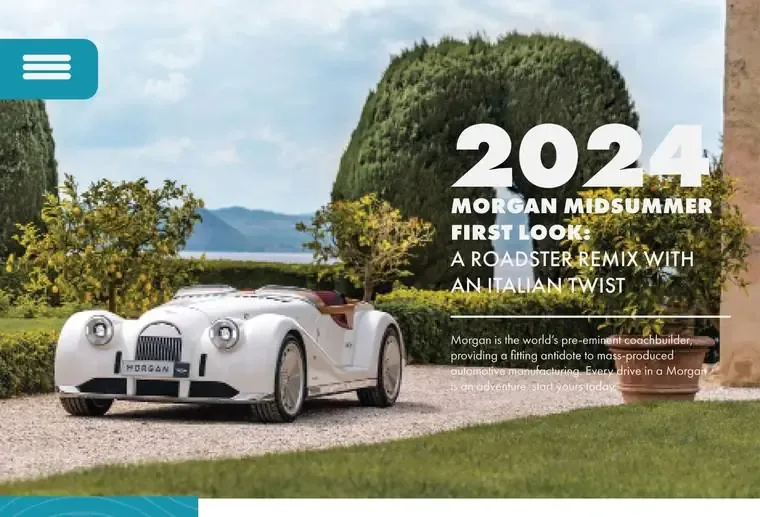
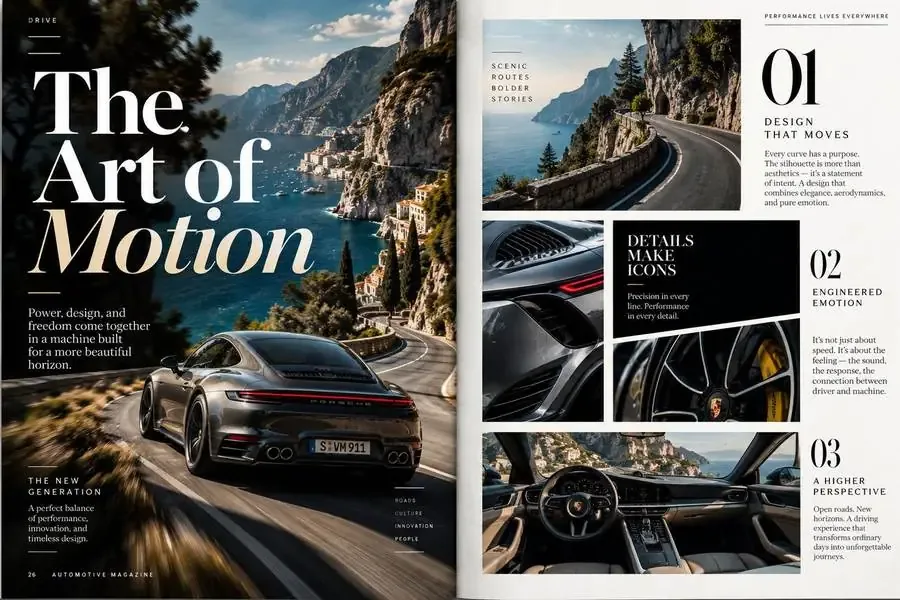
Automotive · Landing page concept
Timeless Elegance
A roadster, remixed.
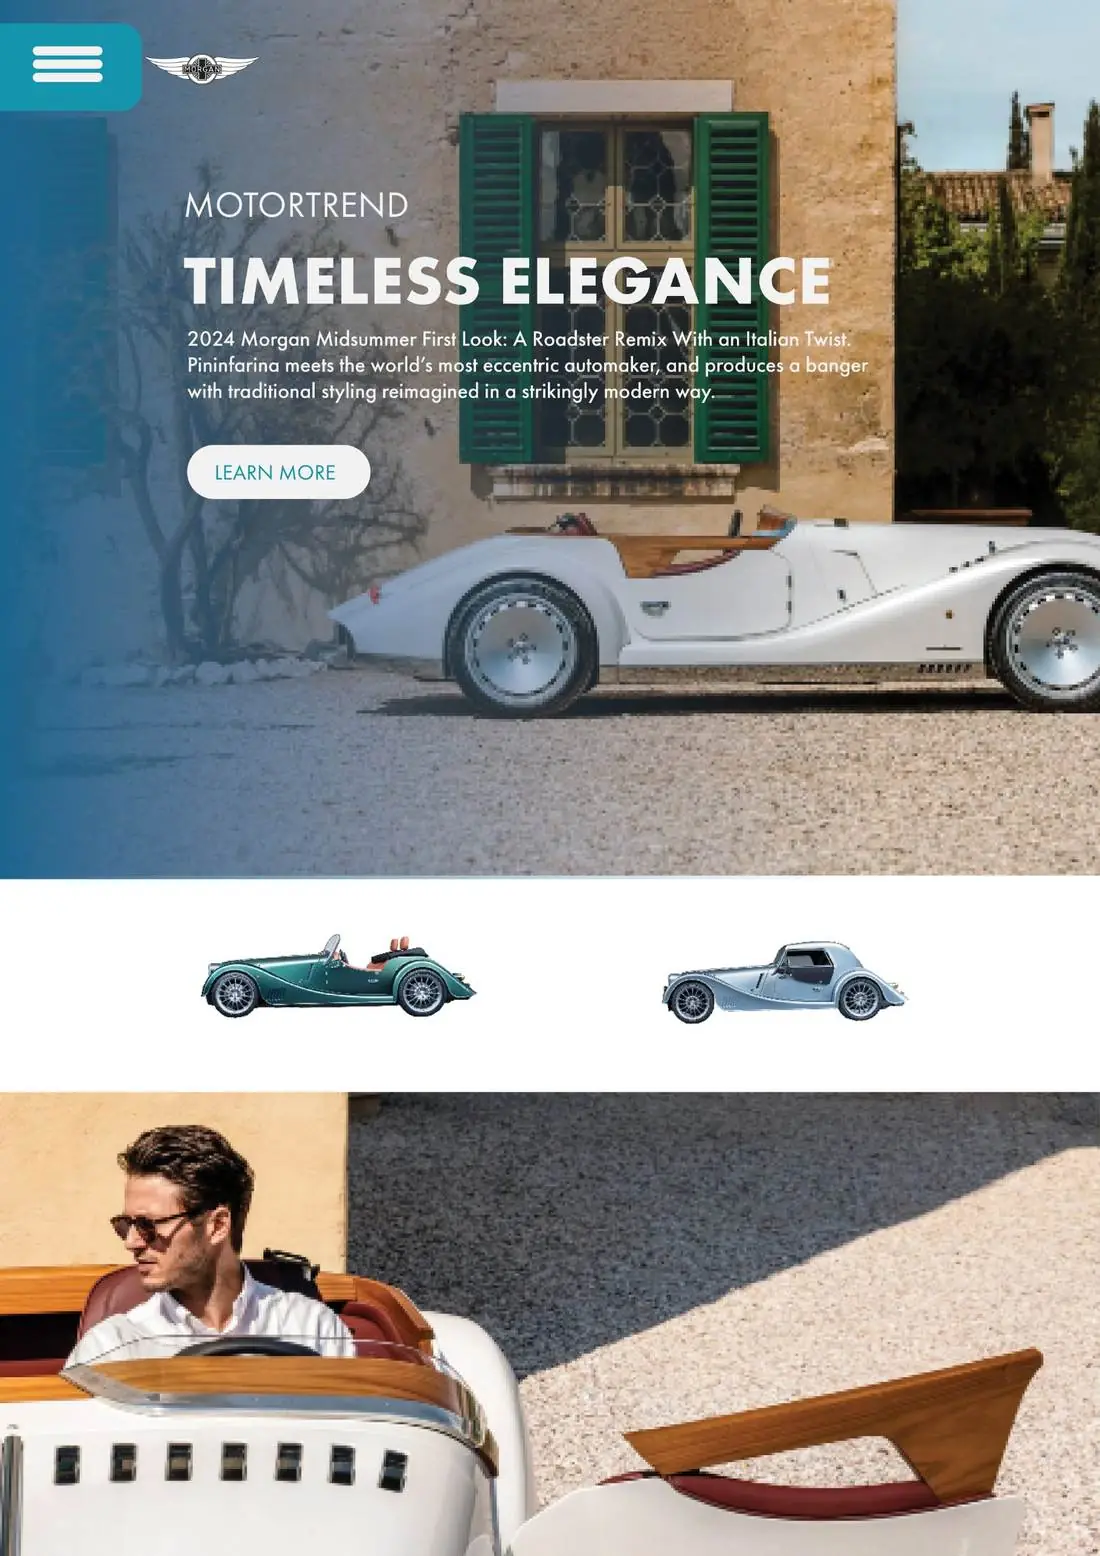
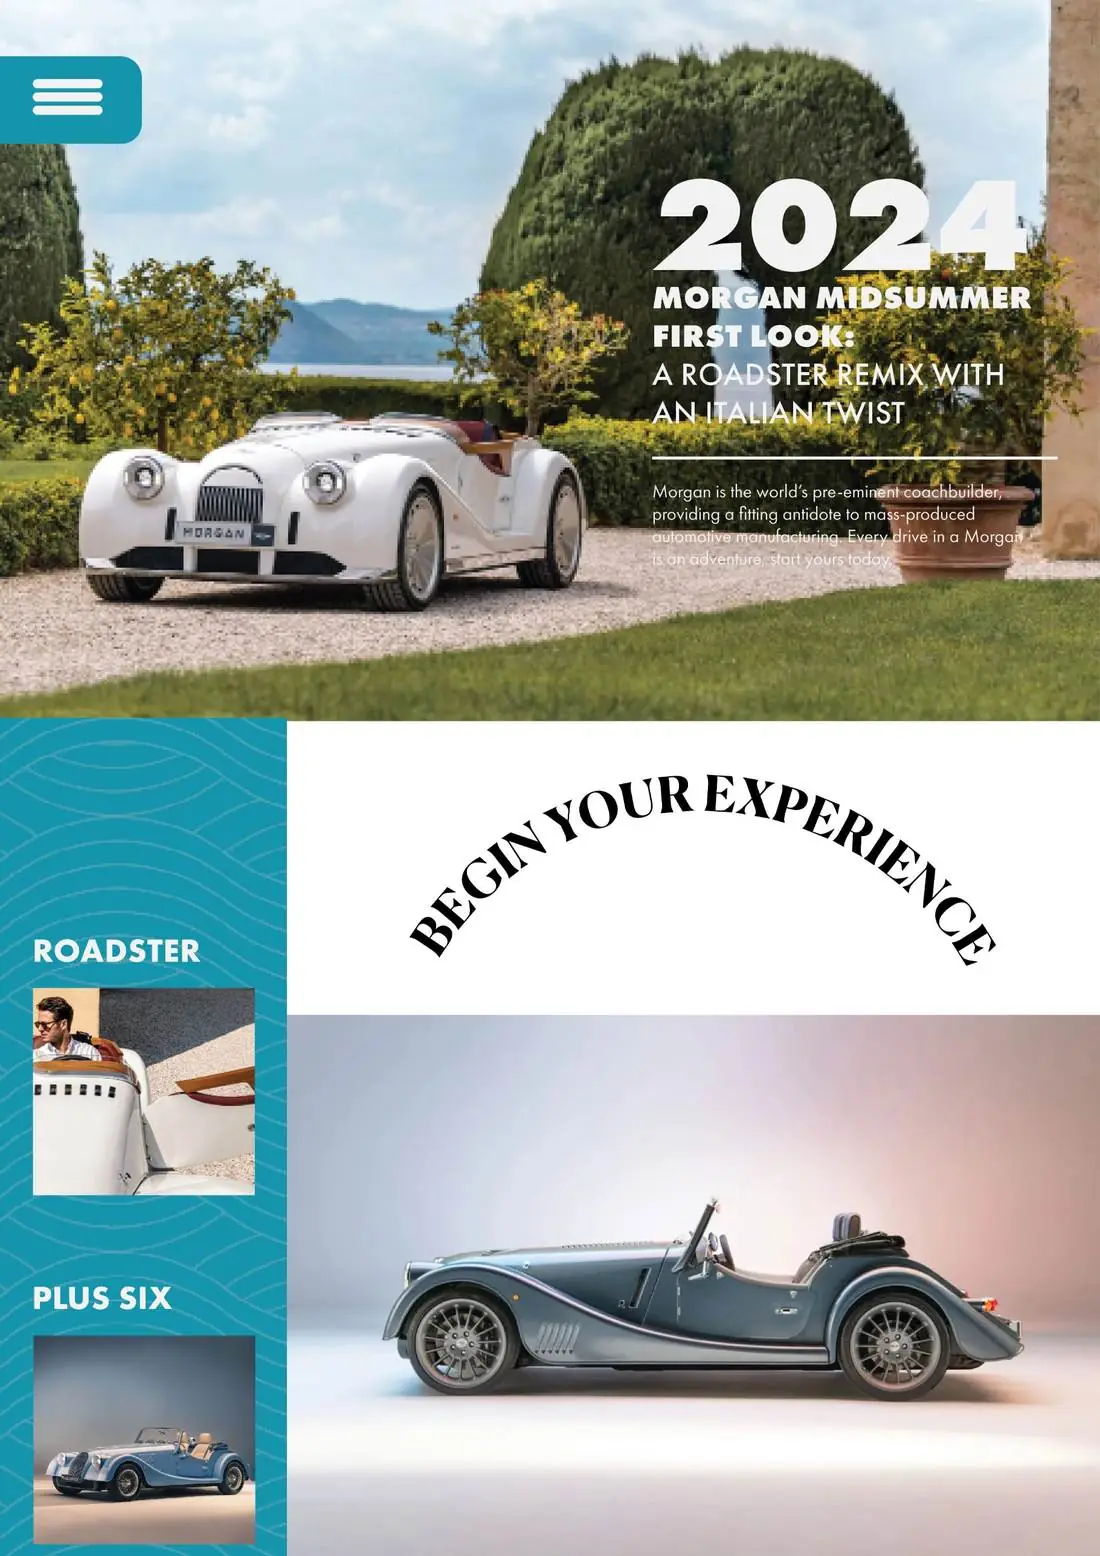
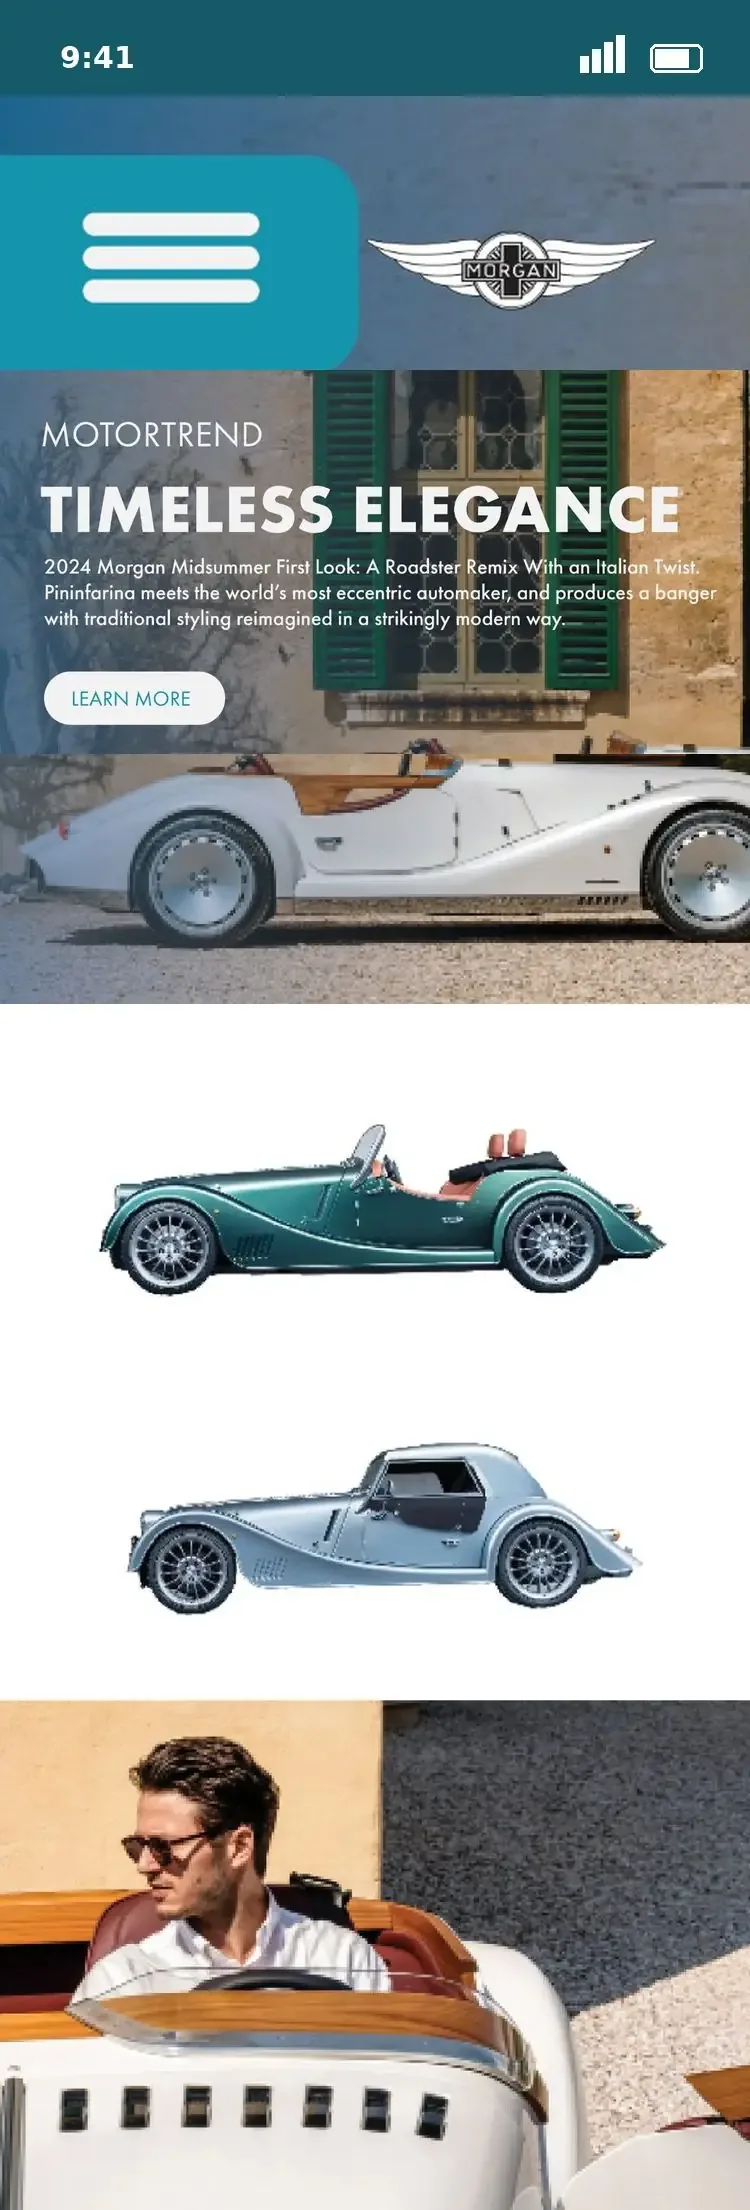
The pages
Desktop layouts · hover a window to scroll
NEXT MOCKUP
Garden City Florist Want one like this? Let’s talkINFOGRAPHIC & DATA DESIGN · CASE STUDY
How the World Reads
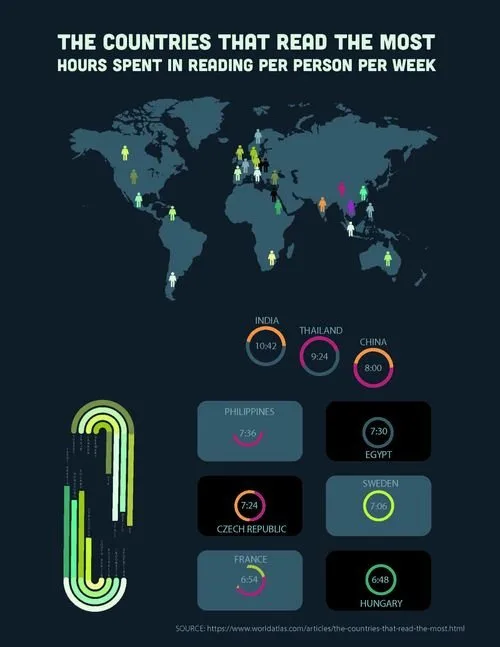
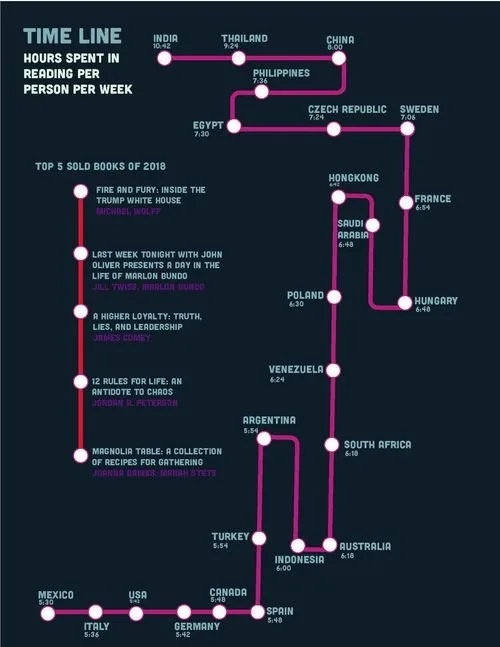
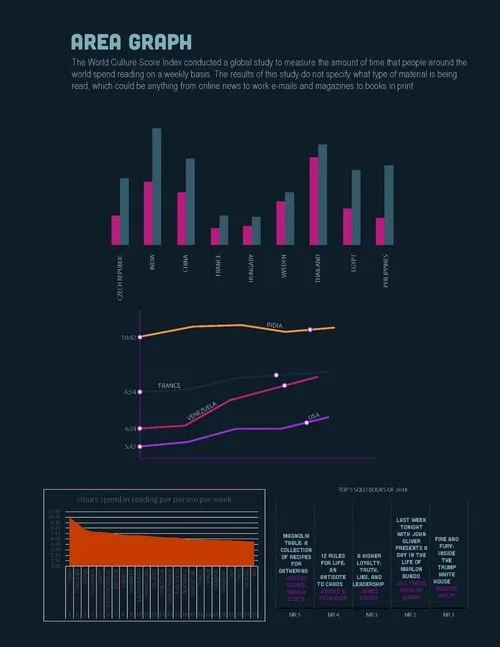
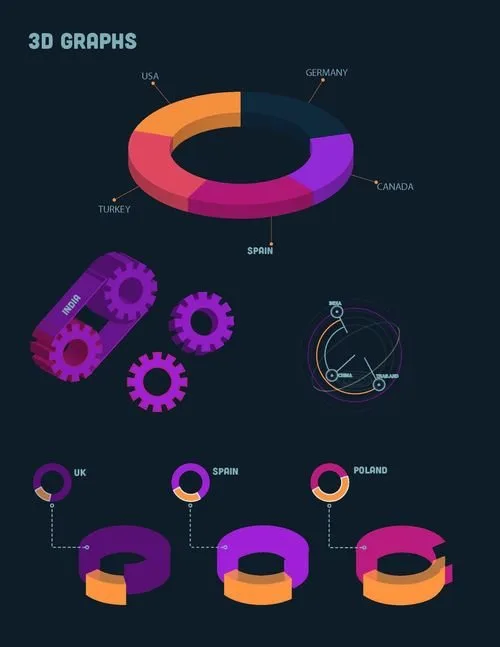
One dataset, directed into a visual story across 25 countries. World Culture Score Index and Publishers Weekly data, rebuilt as a world map, stat rings, an area graph, a 3D breakdown and a subway-style timeline.
WHERE THE WORLD READS MOST
Hours spent reading, per person, per week.
Books, e-mail and news combined. Source: World Culture Score Index, as published in the infographic.
ONE STORY, MANY FORMATS
The same data, five ways in.
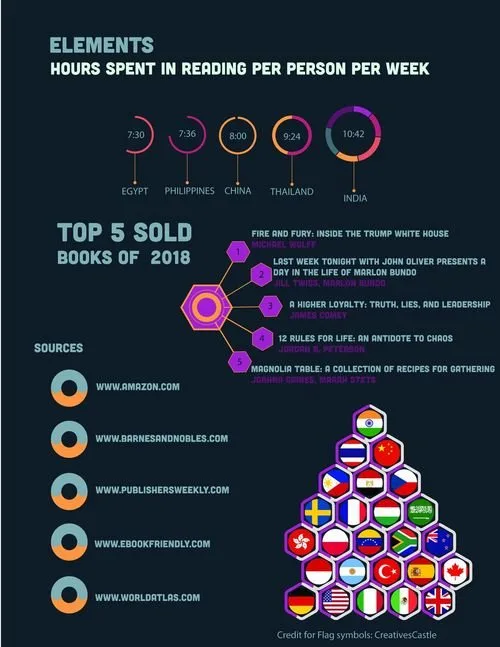
TOP 5 SOLD BOOKS OF 2018
What the world was reading.
Sources: Amazon, Barnes & Noble and Publishers Weekly sales data.
- 1Fire and Fury: Inside the Trump White HouseMichael Wolff
- 2Last Week Tonight with John Oliver Presents A Day in the Life of Marlon BundoJill Twiss, Marlon Bundo
- 3A Higher Loyalty: Truth, Lies, and LeadershipJames Comey
- 412 Rules for Life: An Antidote to ChaosJordan B. Peterson
- 5Magnolia Table: A Collection of Recipes for GatheringJoanna Gaines, Marah Stets
BUILT TO PRESENT, NOT JUST PRINT
Bold type and a dark palette, readable on an easel or a phone.
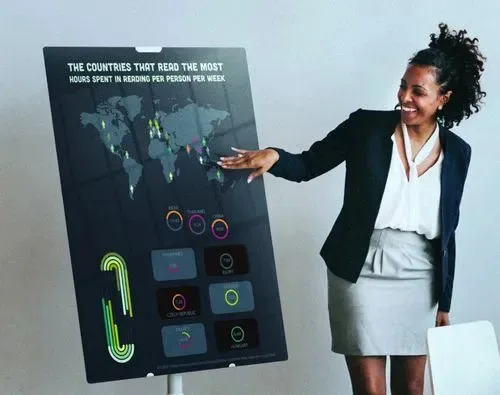
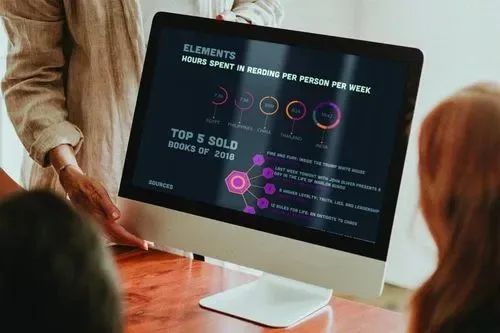

Each country keeps one accent colour across every chart, on a near-black base.
Drafts were reviewed with research and editorial teams before the final system was set.
Interested in a similar project?
Available for art direction on your next infographic, data visualization or editorial design project.
INFORMATION INFOGRAPHIC · DIGITCELLS
Tissue Workflow Optimization for Digital
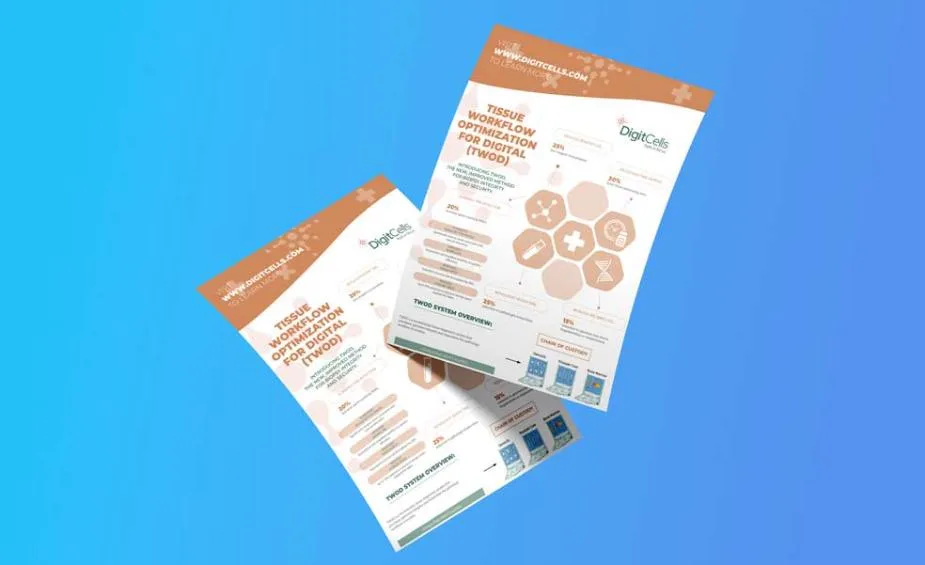
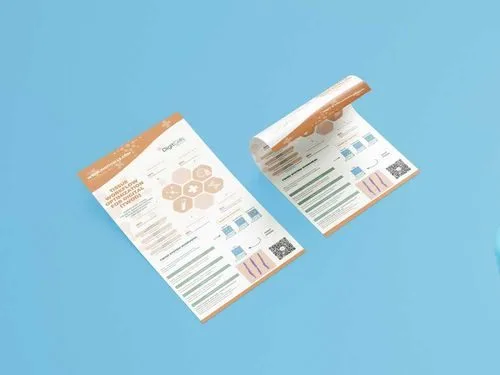
Introducing TWOD, the new improved method for biopsy integrity and security. A product launch turned into information people can take in at a glance: an infographic flyer, a two-sided brochure and a one-page efficiency sheet.
THE FULL SYSTEM
One product, three pieces, one visual language.
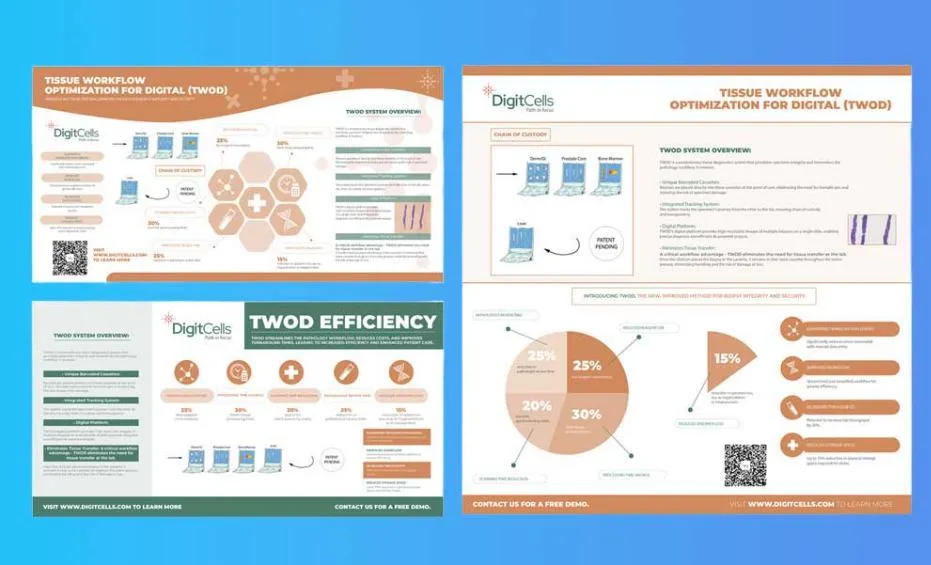
A cluster of hexagon icons carries the system across every piece, so each benefit has its own recognisable mark.
Percentage call-outs and pie charts turn the efficiency story into numbers a reader can scan in seconds.
Every piece ends with an action: a QR code, “Contact us for a free demo” and the website.
Have complex information to explain?
CREATIVE DIRECTION CASE STUDY · SELF-INITIATED
Ohana
A party game of stories, connection, and a little friendly trivia.
An original party game of 475 cards. Doro Concept created the concept, the mechanics and every card, then directed the visual design, playtesting and production, all the way to packaged, production-ready files.
INTERACTIVE CARD PREVIEW
Draw a card.
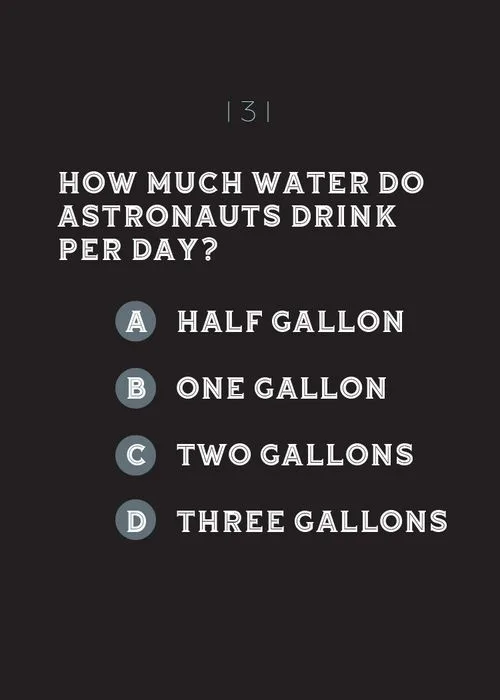
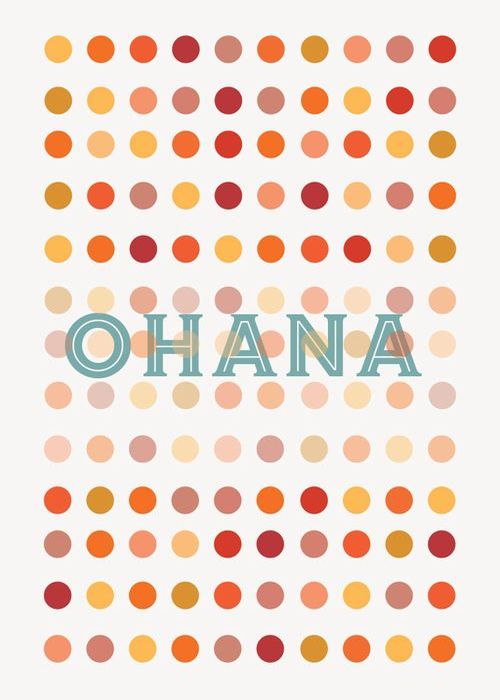
Hover or tap any card to turn it over and read the question. Real cards from the game, in three colour-coded decks.

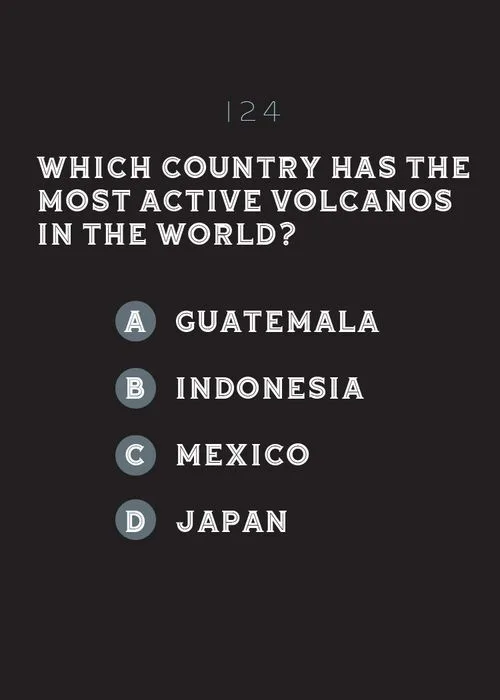

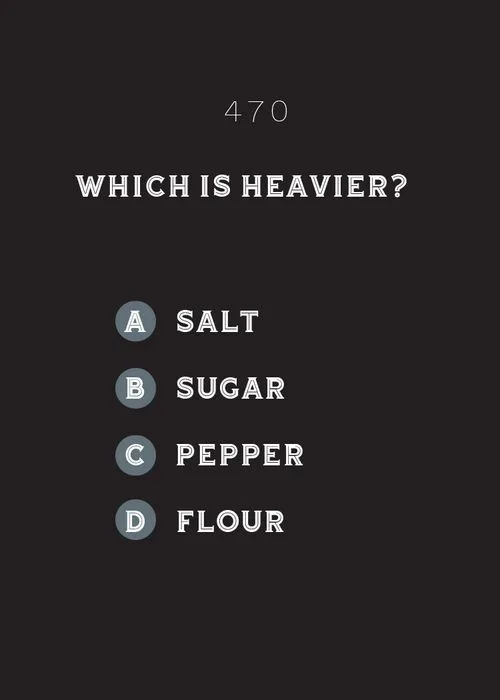
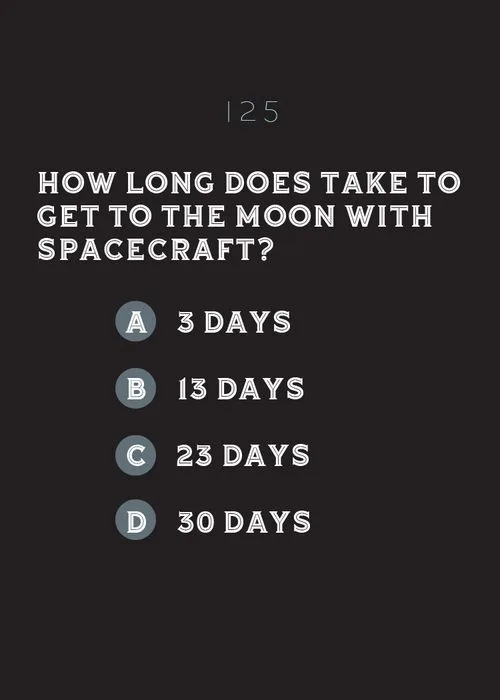
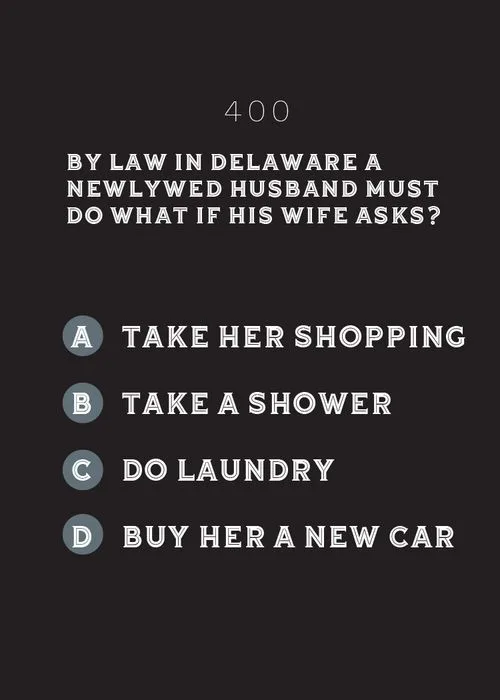
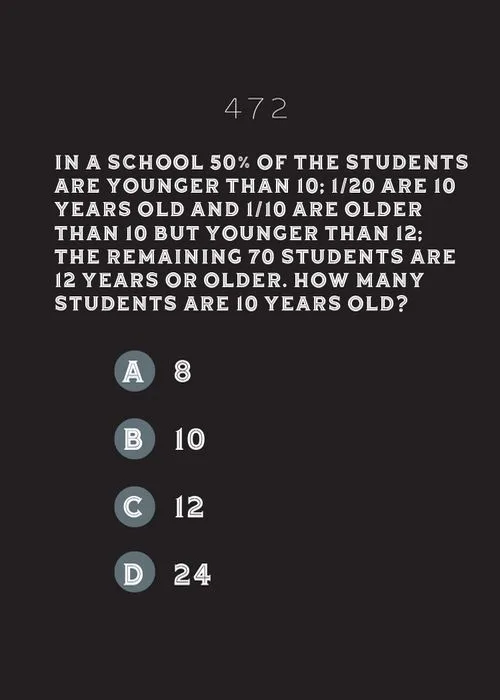
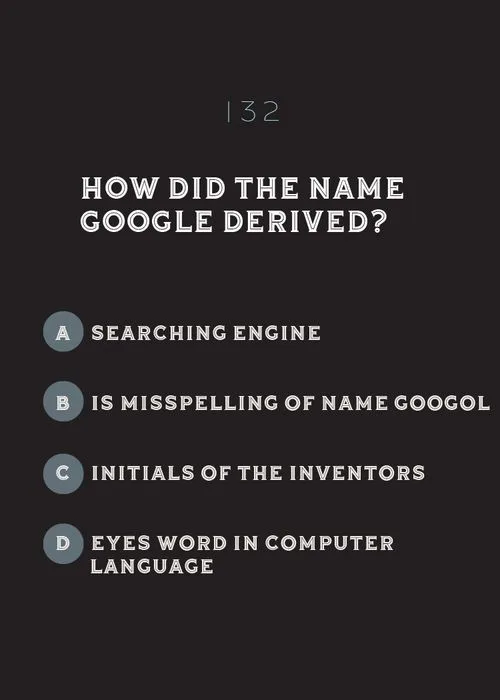
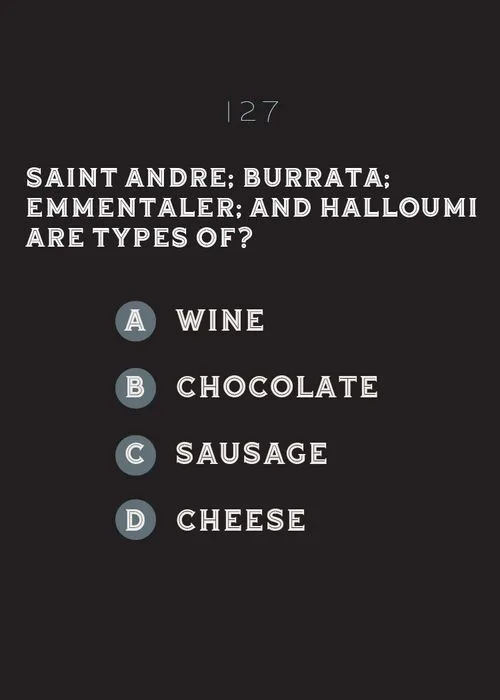
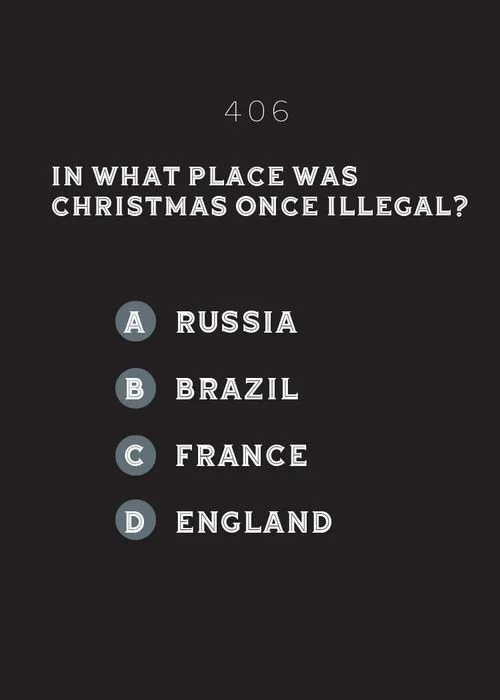
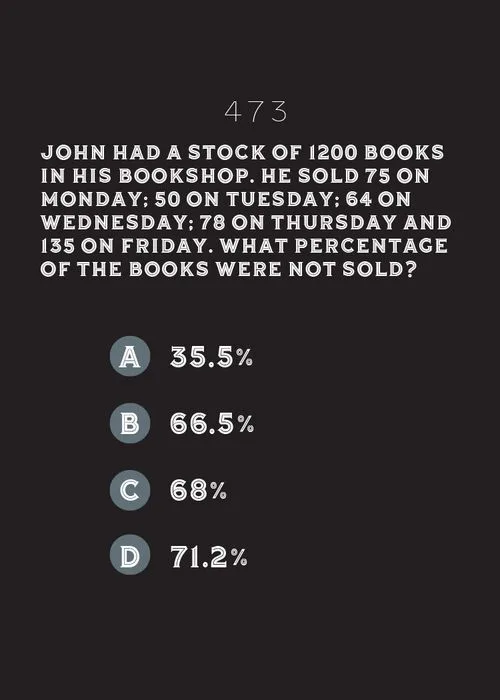
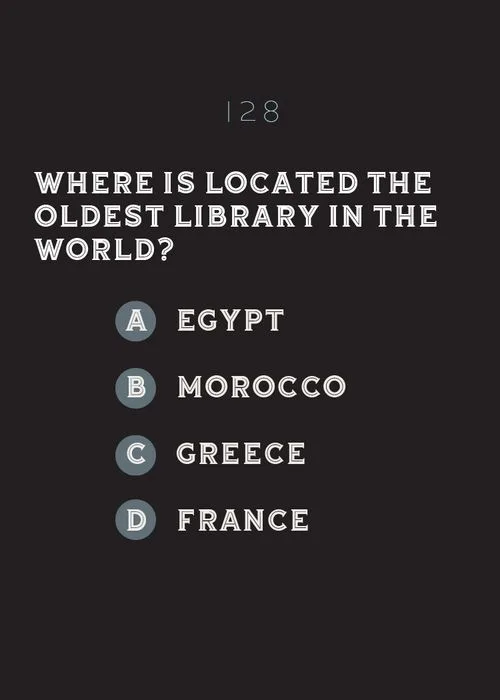
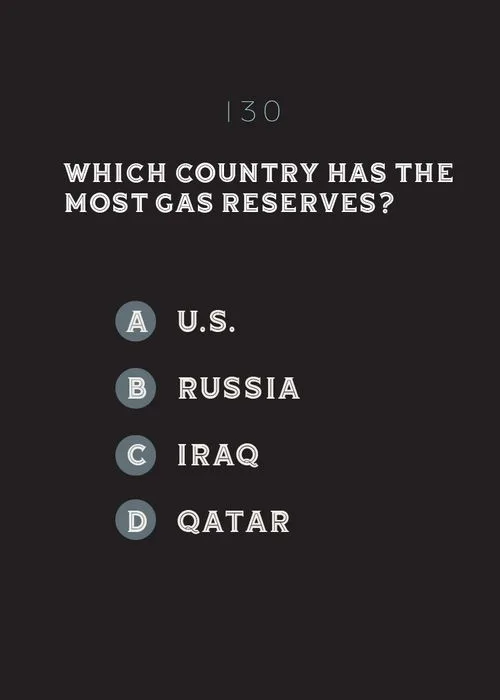
FROM IDEA TO BOX
Concept to production, in one hand.
- 01ConceptA game built around stories, connection and light trivia, where the conversation is the point.
- 02Mechanics & every cardThe rules, the card types and all 475 cards, written and structured from scratch.
- 03Visual systemThree colour-coded decks, yellow, orange and blue, so players read a card before they read a word.
- 04PlaytestingRepeated play sessions refined the colour-coding, the balance of questions and the pacing of a round.
- 05ProductionPackaged, production-ready files, delivered for print.
Have a game, a deck or a product in mind?
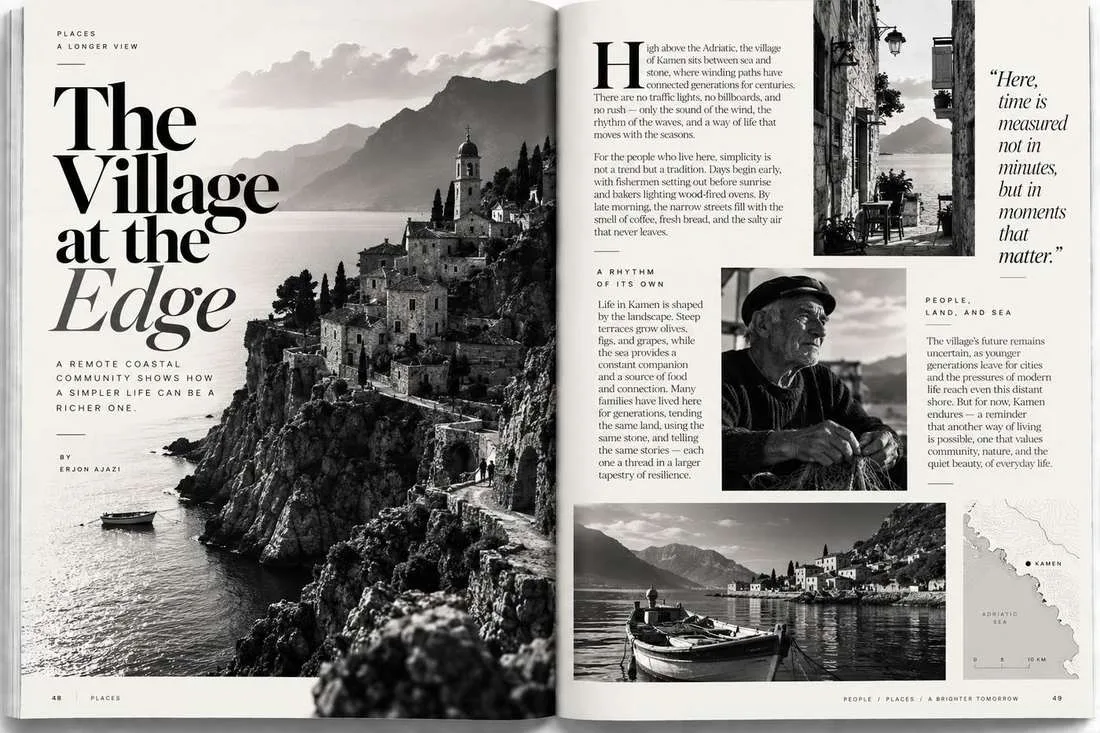
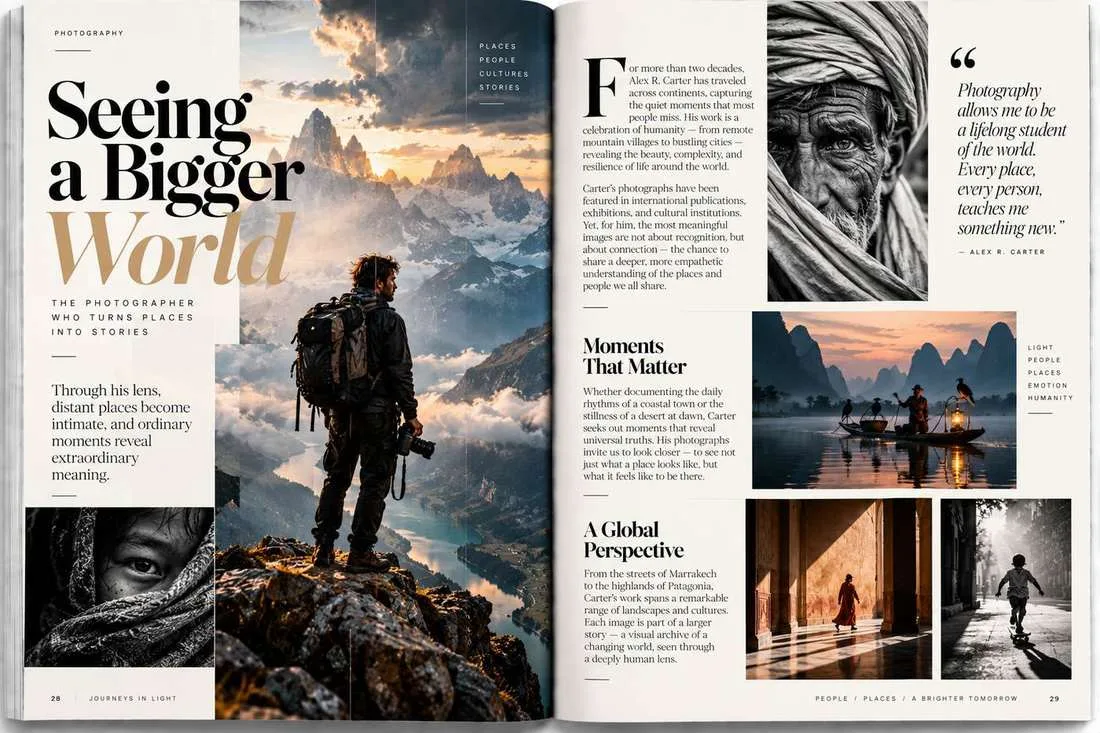
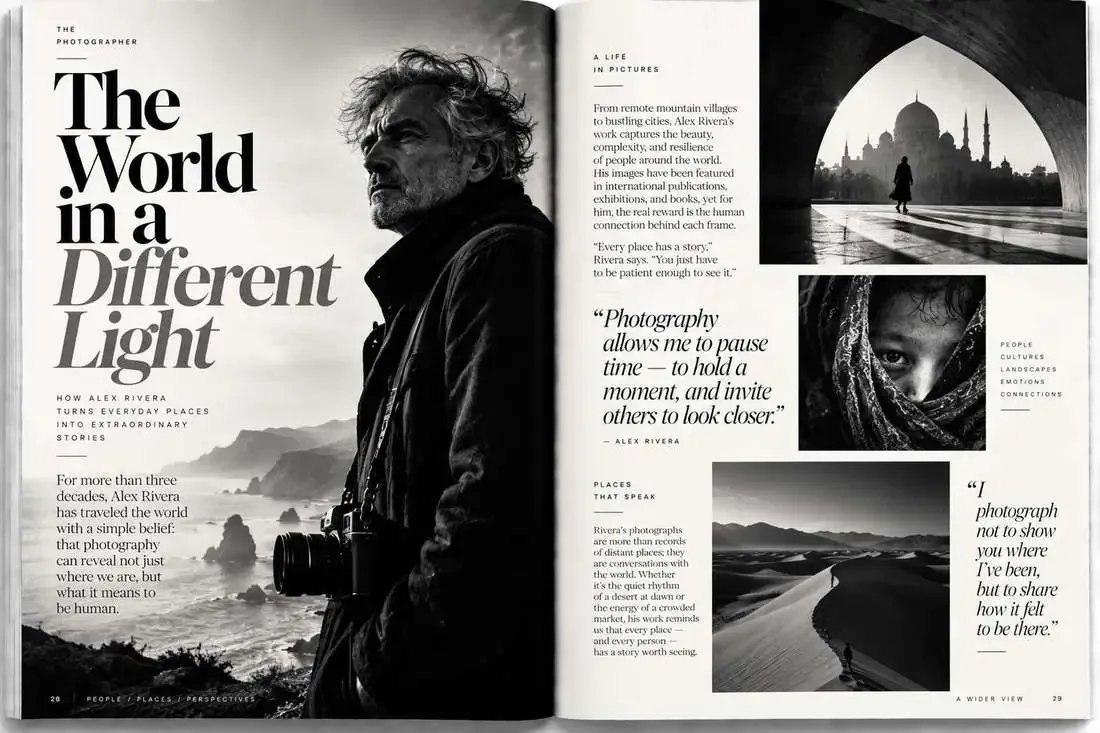
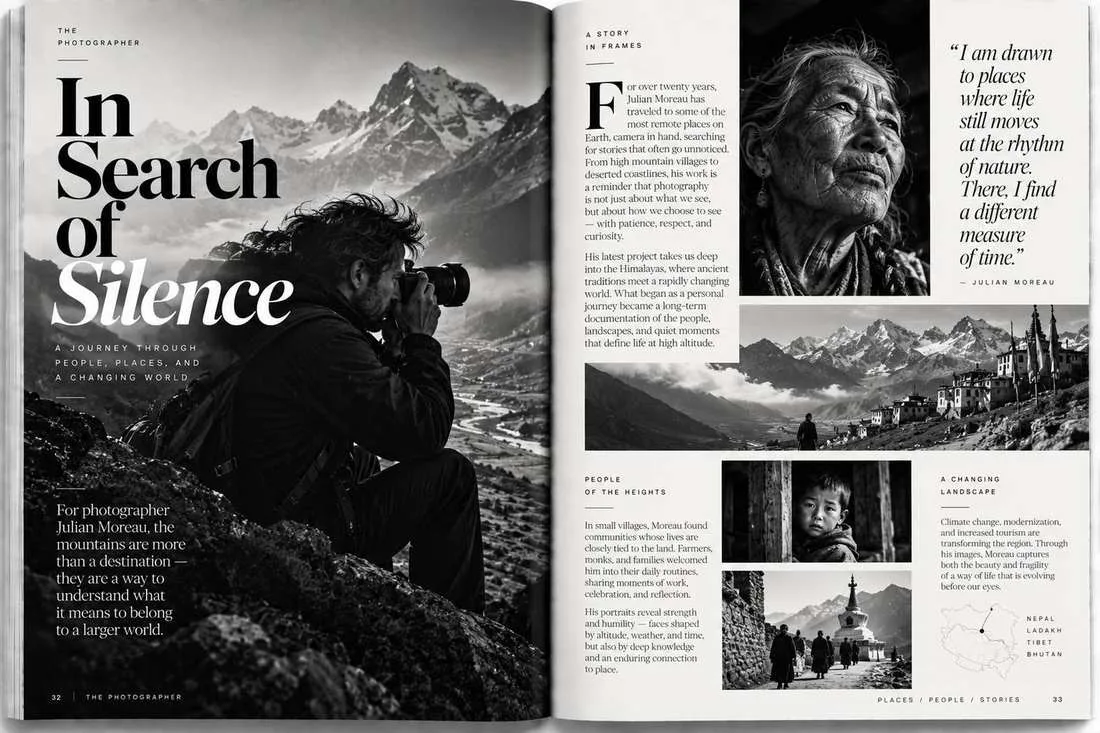
EDITORIAL INFOGRAPHIC · 6 SPREADS · 2026
The World of Coffee
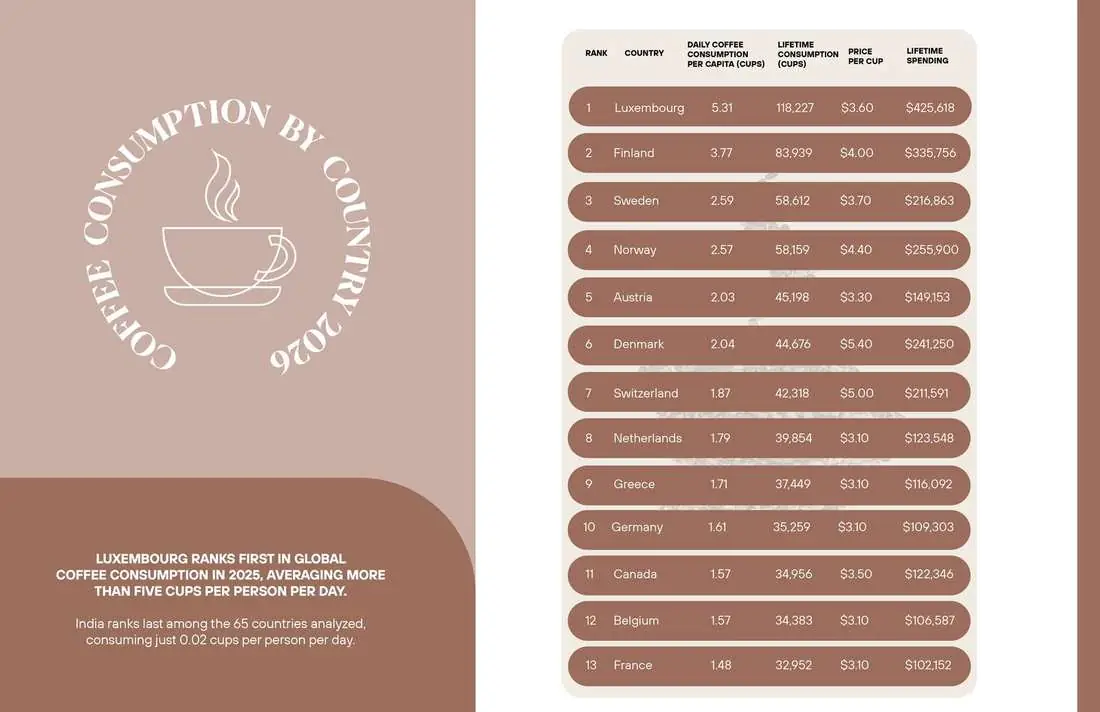
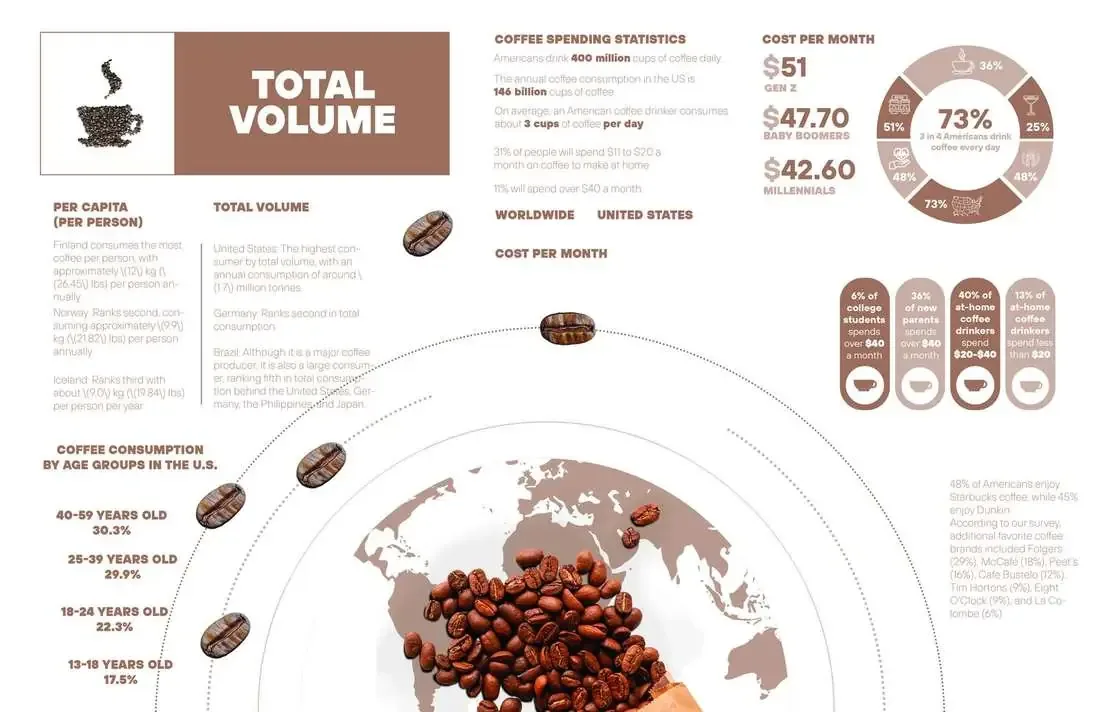
How much the world drinks, what a cappuccino costs from Zurich onwards, and how a bean from Ethiopia became a global ritual. A data story told in six spreads.
Open the interactive editionA DAY IN CUPS
The top and bottom of the 65-country ranking. One cup = one daily cup per person.
INSIDE THE INFOGRAPHIC
Six spreads, one cup at a time.


FROM BEAN TO RITUAL
A thousand years, ten chapters.
Scroll sideways →

The Oromo people mix coffee berries with animal fat for energy Before 1000 A.D.Ethiopia, the birthplaceAmong the Oromo people, coffee was first an energy source for long journeys, hunting and warfare, eaten rather than drunk.
The coffee shop, Cairo. David Roberts, R.A., via Library of Congress 10th centuryQahwa in YemenArab traders brought coffee to Yemen, cultivated the plant and brewed a drink called qahwa, used to stay awake through nights of prayer.
Coffee used as medicine in the Middle East 11th centuryA medicine firstCoffee was prescribed by physicians for stomach problems and headaches, valued for healing rather than pleasure.- 15th centuryThe first coffee housesCoffeehouses appeared in Yemen’s Sufi monasteries, and the first known coffee shop opened in Mecca in the early 1500s.

Interior of a London coffee-house, 17th century, via Wikimedia Commons 16th centuryInto the Ottoman Empire and EuropeVenetian traders carried coffee to Europe; the first European coffeehouses opened in Venice (1615–1645), then Vienna, Paris, London and Amsterdam.
Dutch engraving of the Port of Mocha, 1692, via Wikimedia Commons 17th centuryThe “bitter invention of Satan”Dutch and Portuguese traders took coffee to Japan, while bans came and went from Mecca to Venice, Sweden and Prussia.
Gabriel de Clieu transporting coffee to Martinique, via Wikimedia Commons 18th centuryCoffee replaces teaIn the New World, Americans switched to coffee as a patriotic alternative to taxed British tea.
Tontine Coffee House, New York City, 1797, via Wikimedia Commons 19th centuryA global powerhouseCoffee became an agricultural and economic force, drunk across every class.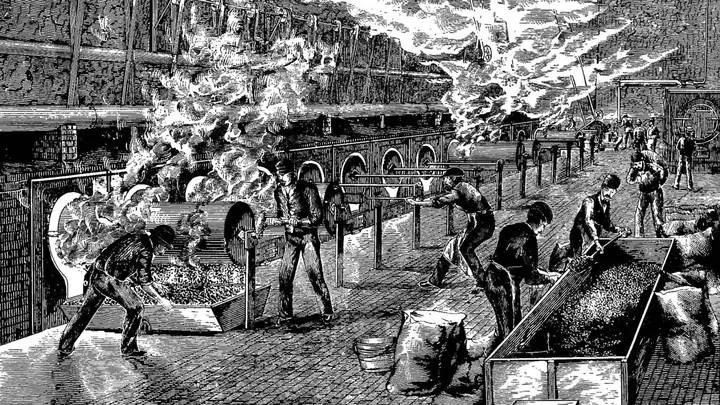
Industrial coffee roasting, 1800s, via Wikimedia Commons 20th centuryWar and the modern cupWorld War II raised demand and drove new ideas in packaging and distribution.- 21st centuryThe specialty eraSpecialty coffee has grown 80% since 2011; the global market is projected to reach 174.25 billion by 2030.
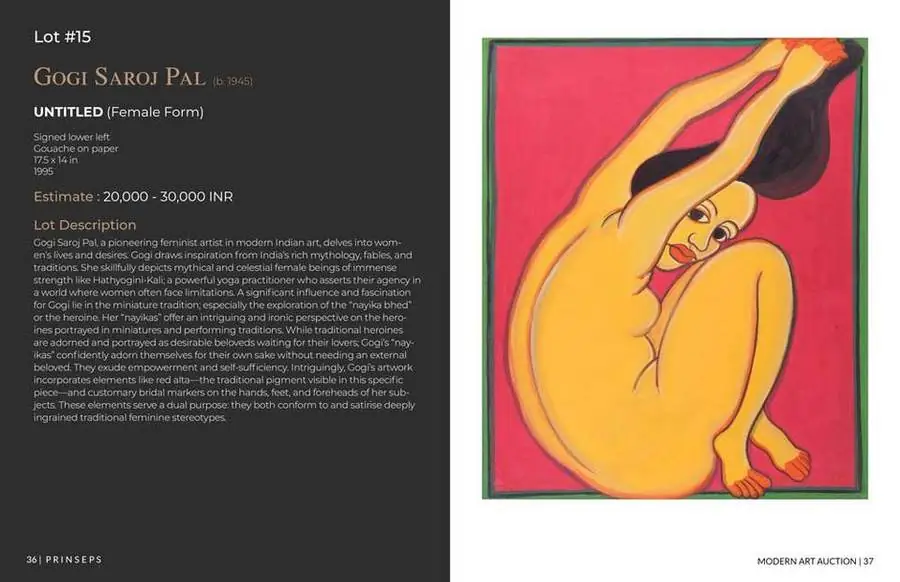
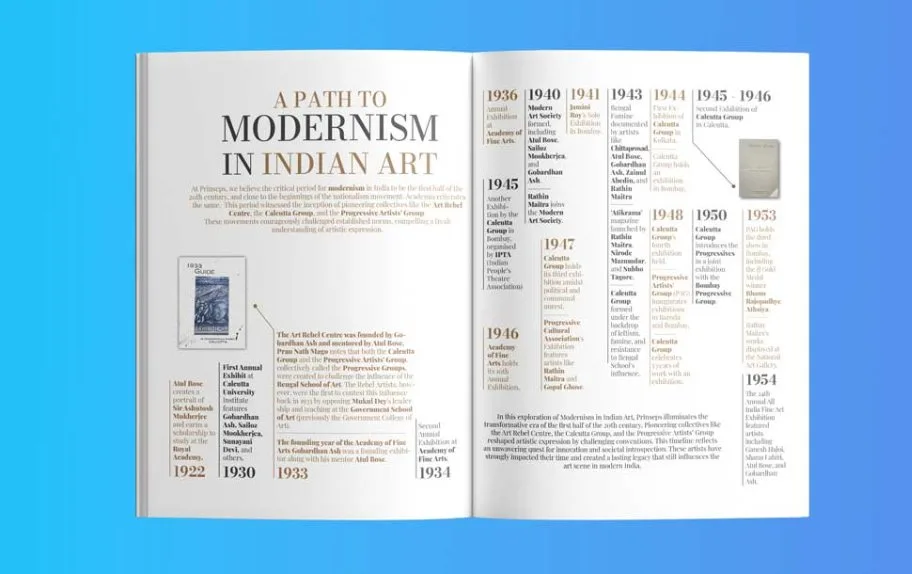
Modern Art Auction
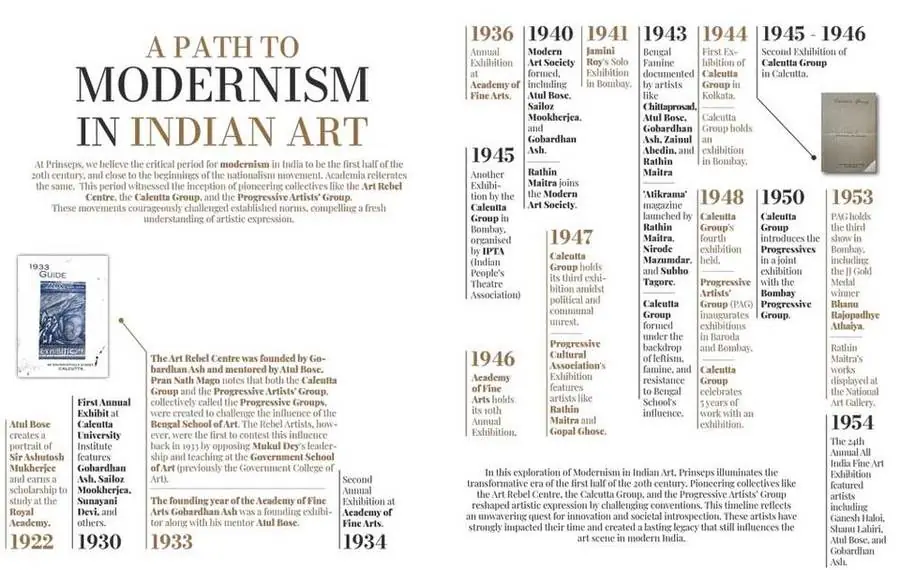
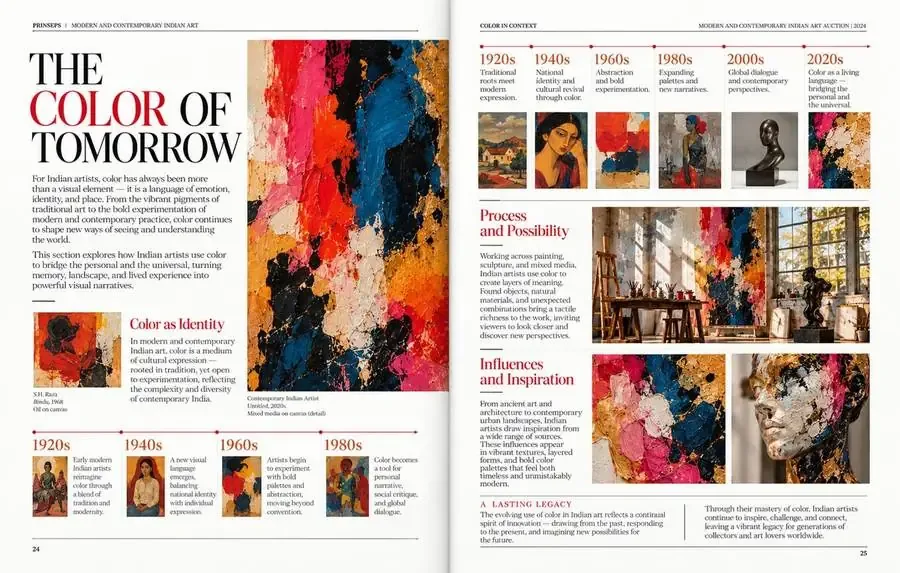
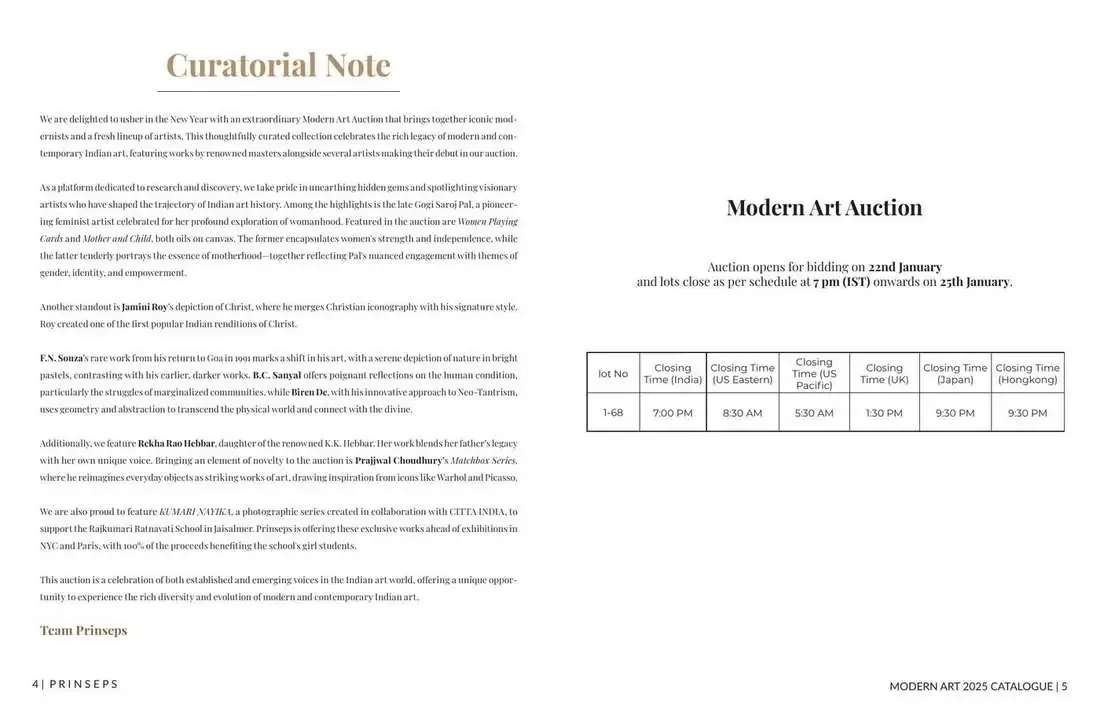
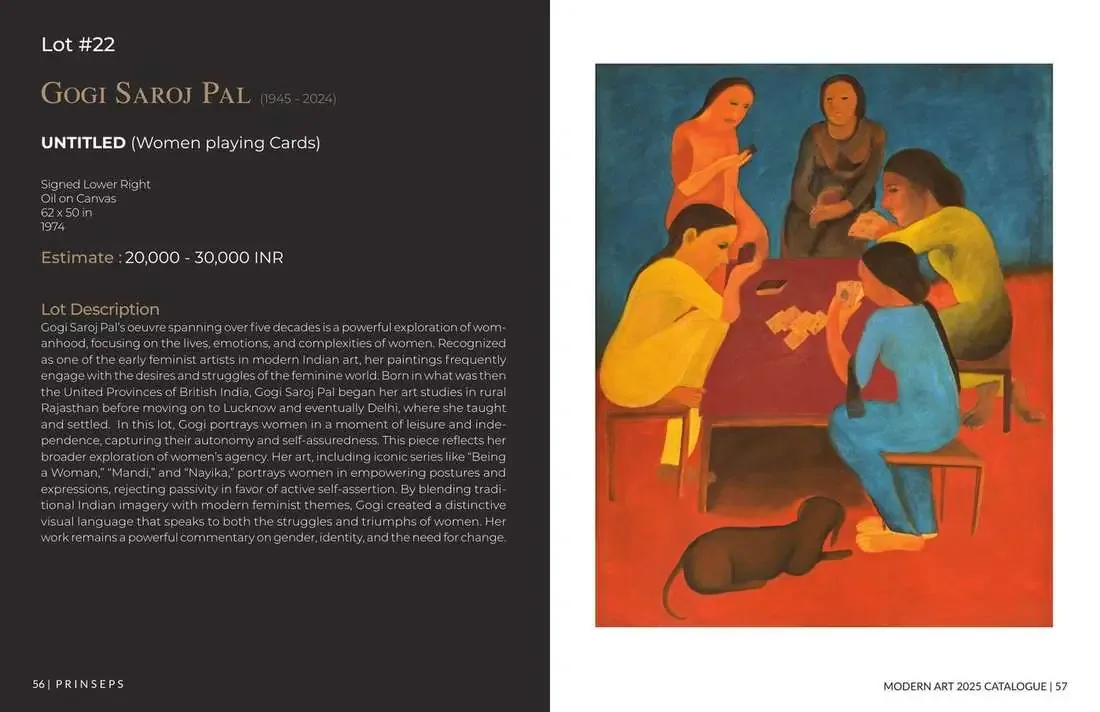
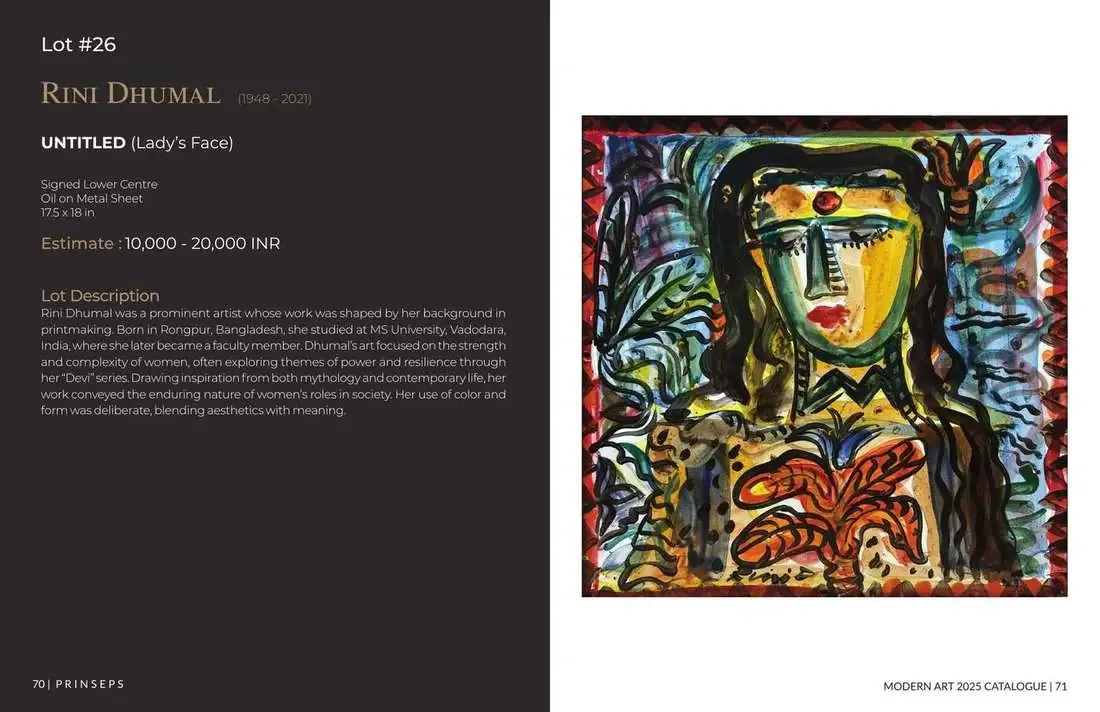
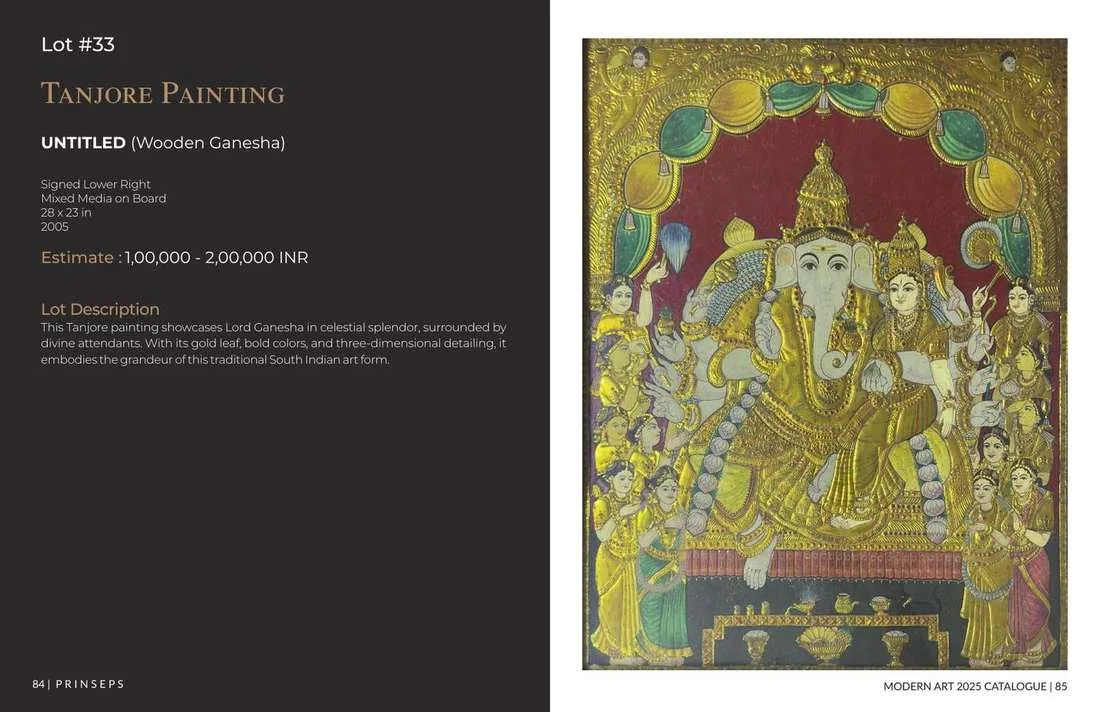
An 85-page catalog for Prinseps’ Modern Art Auction, February 2025: 68 lots of modern and contemporary Indian art, with a curatorial note, artist features and archival essays, designed to read like a gallery walk.
View the full catalog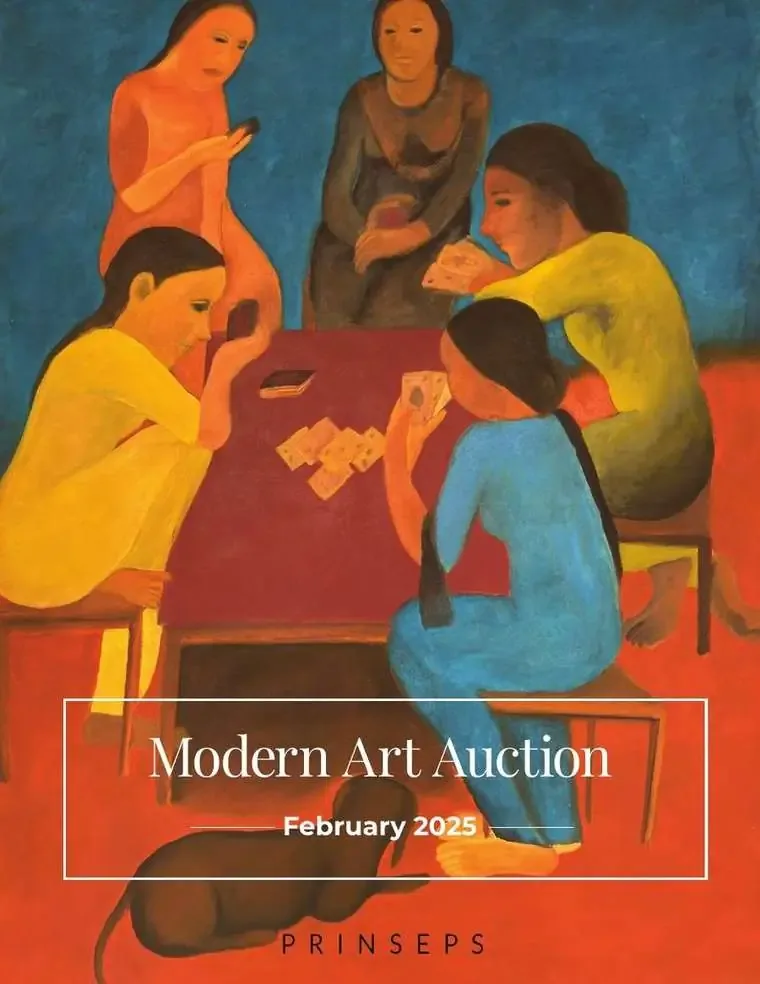
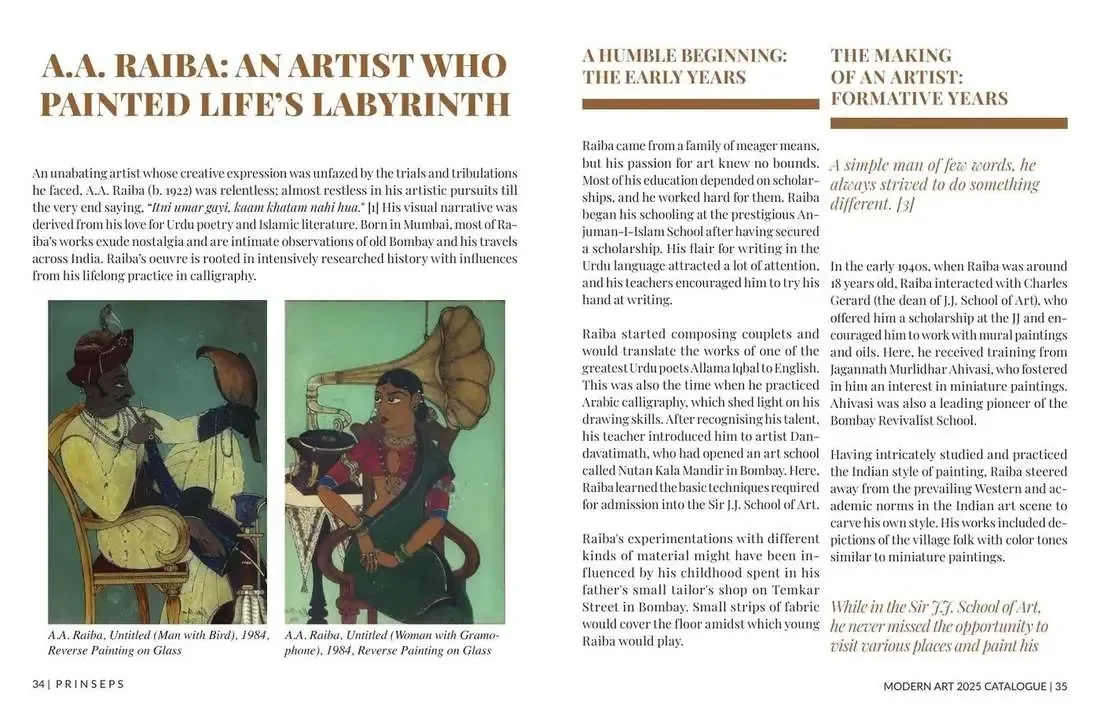
Each lot gets its own spread: a dark text page carrying the artist, title, medium, estimate and lot description, facing the artwork on a clean white page. The rhythm stays consistent across 68 lots, so the art always leads.
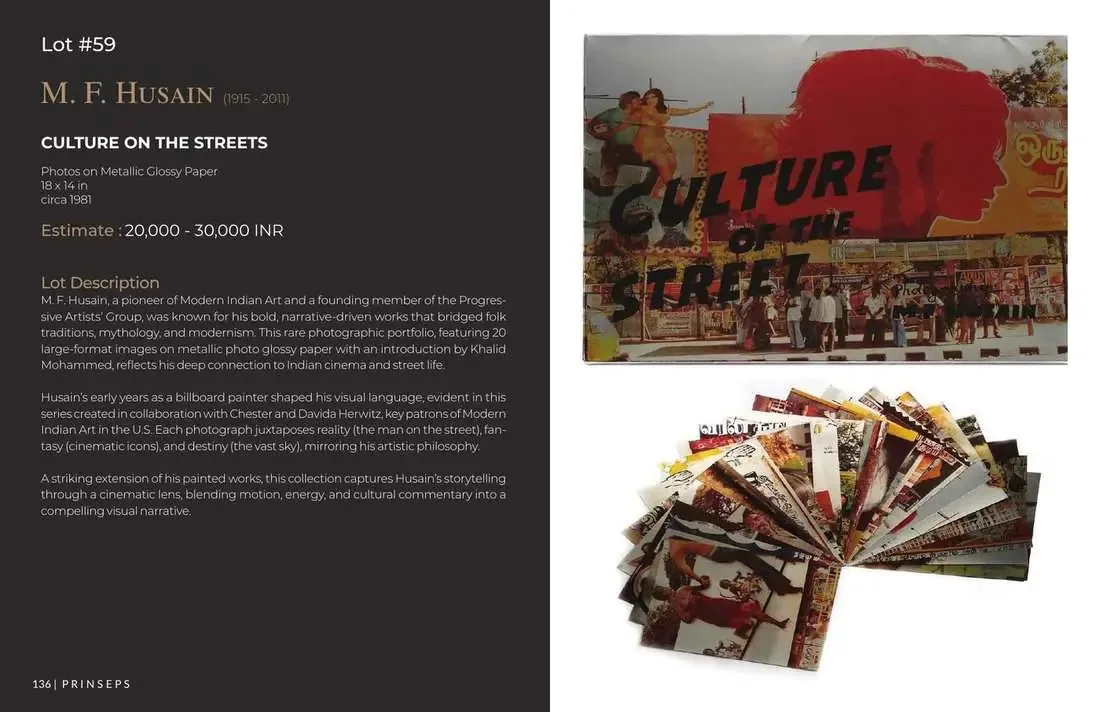
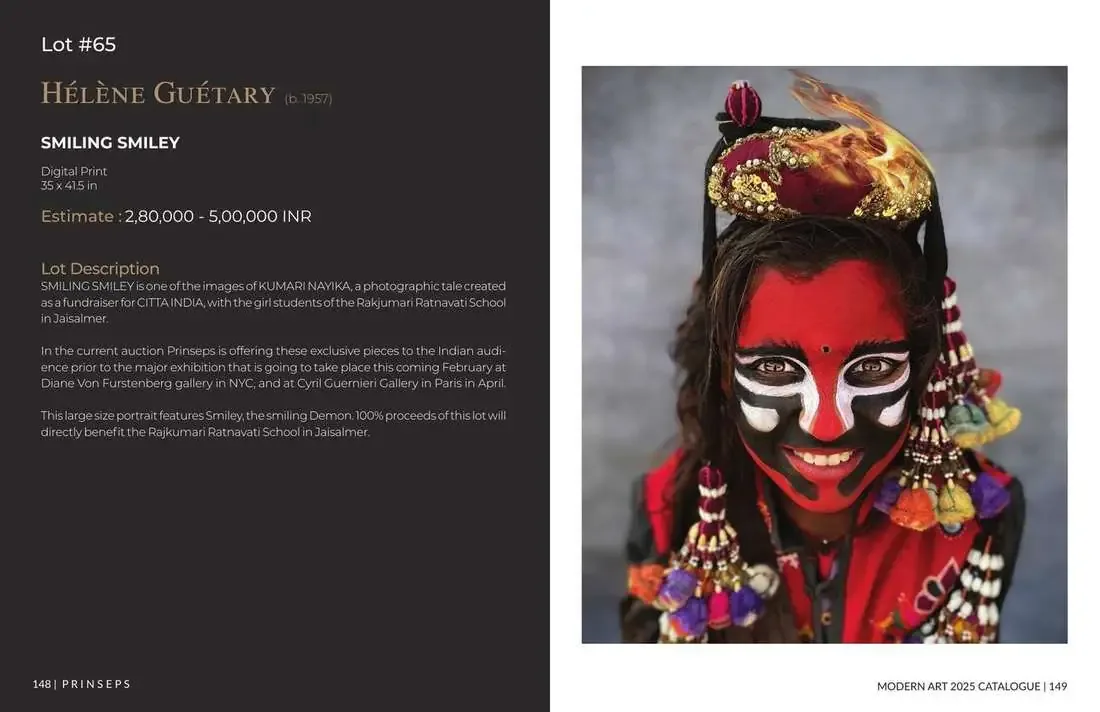
See all 85 pages in the interactive edition.
View the full catalog
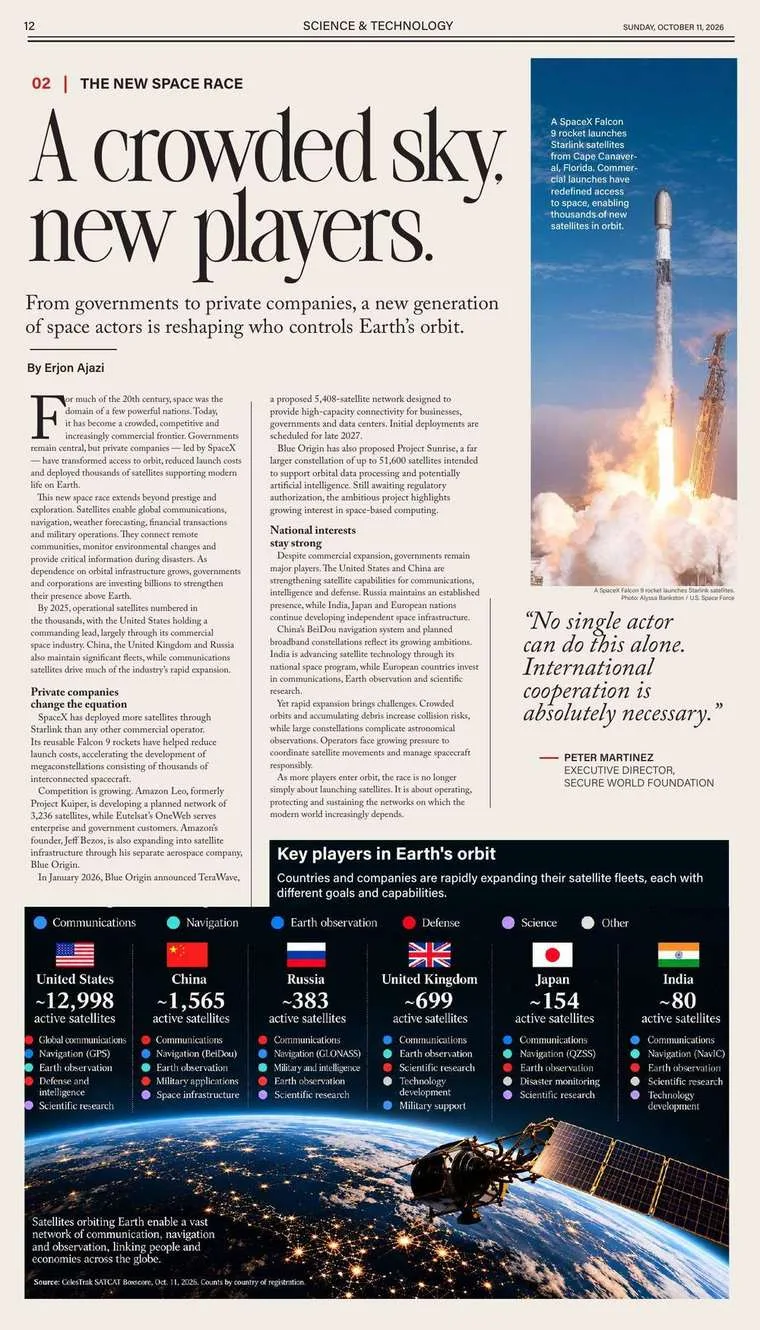
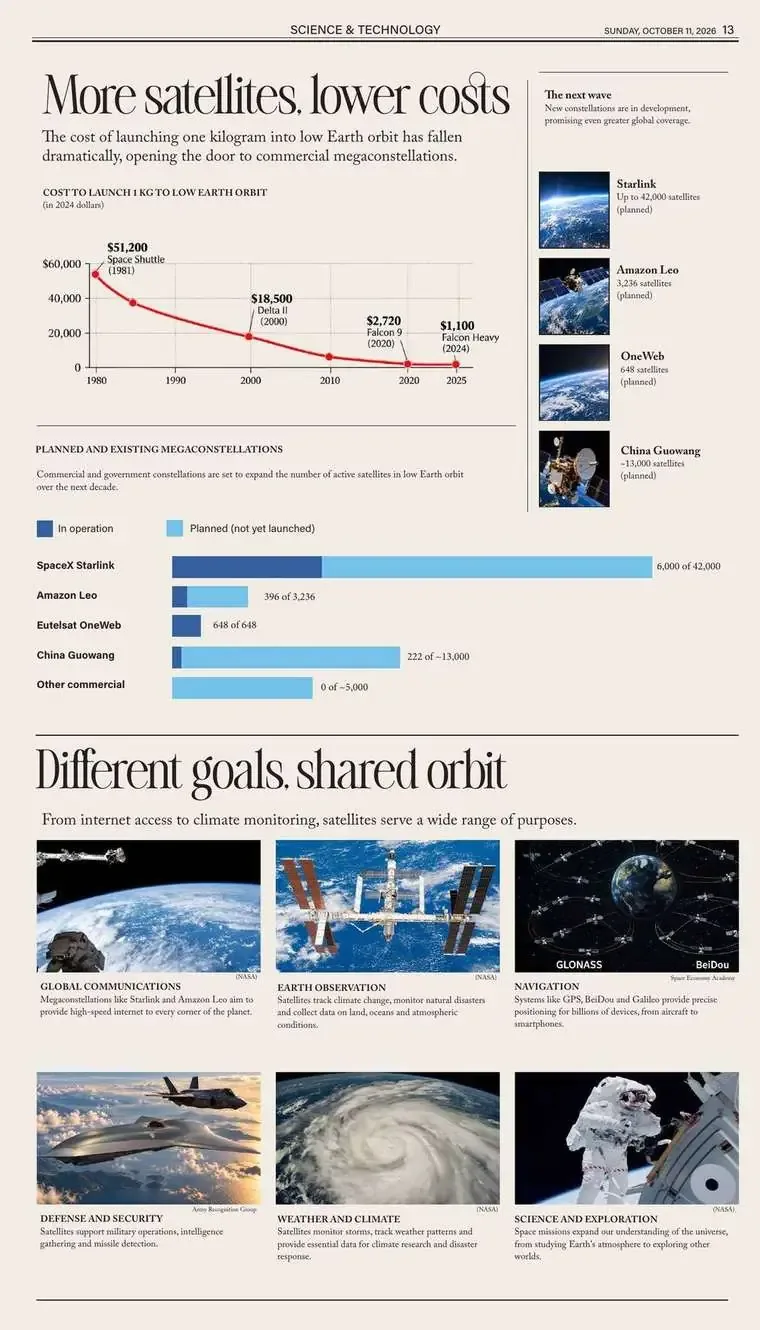
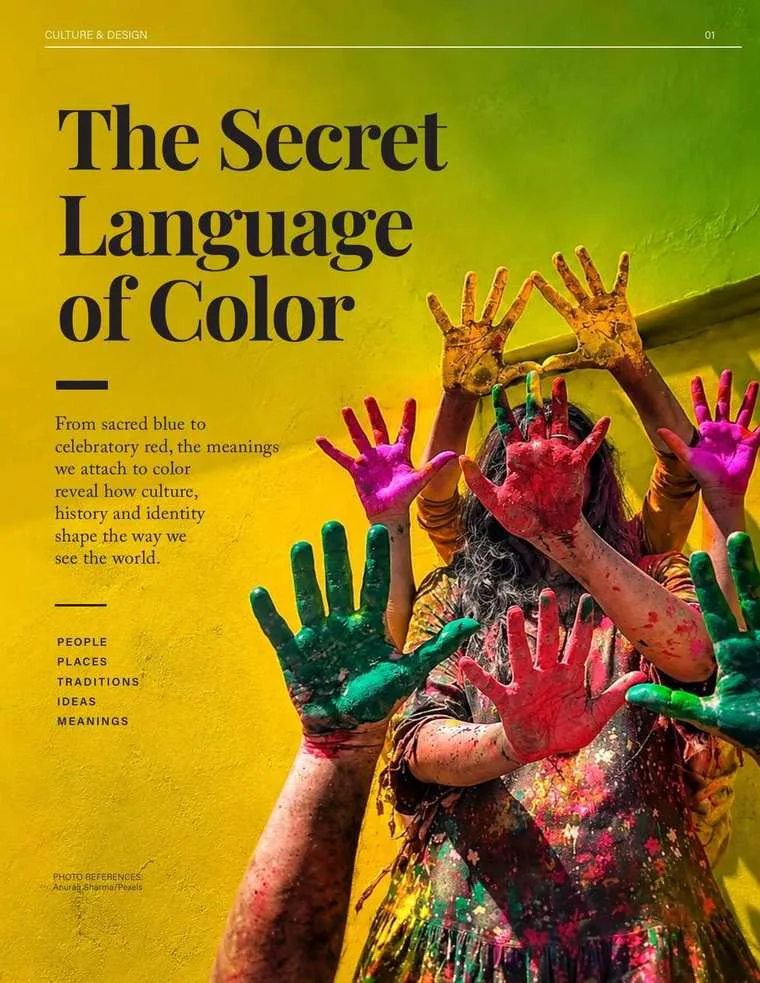
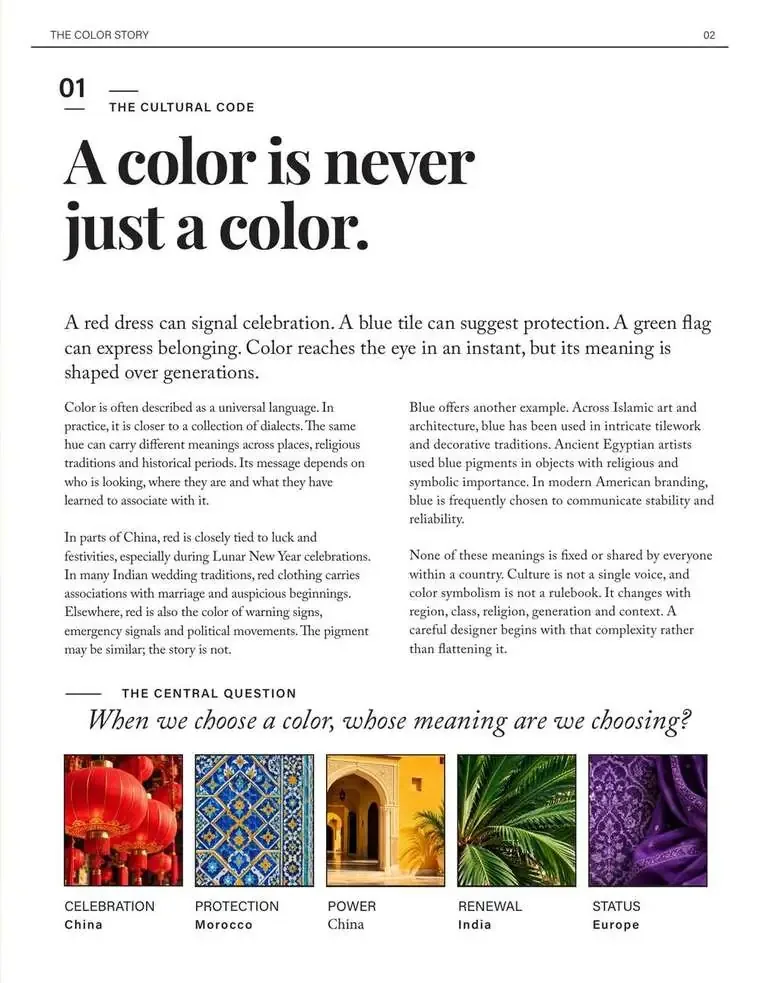
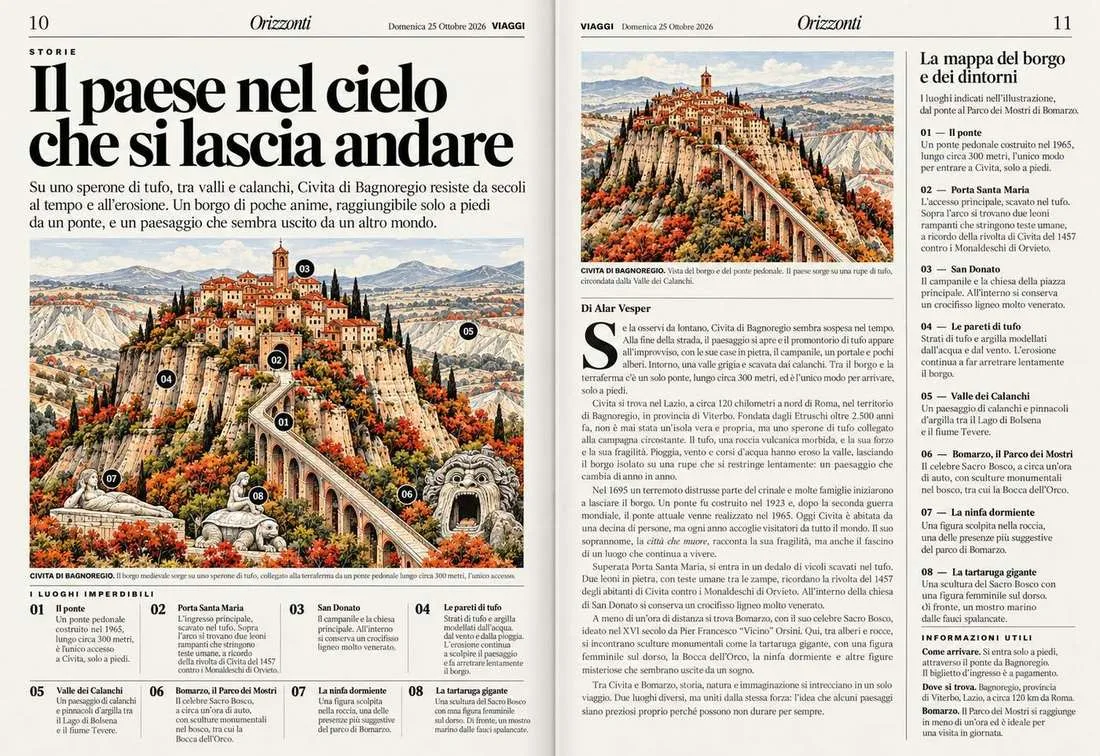
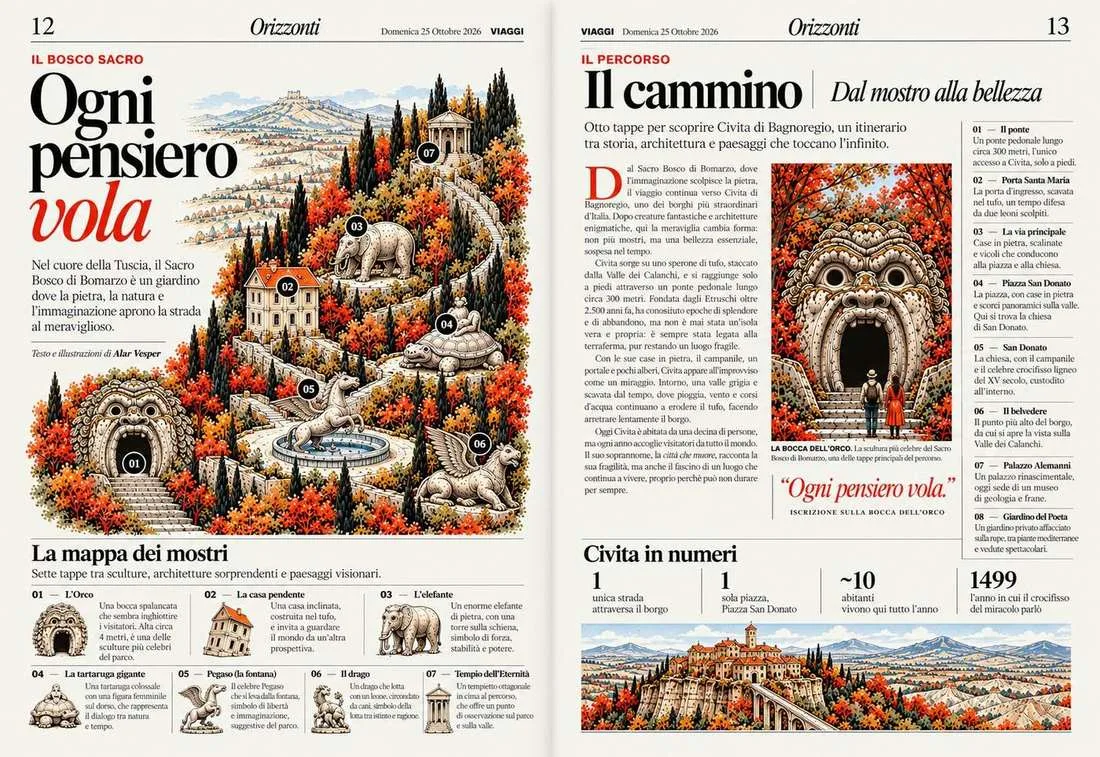
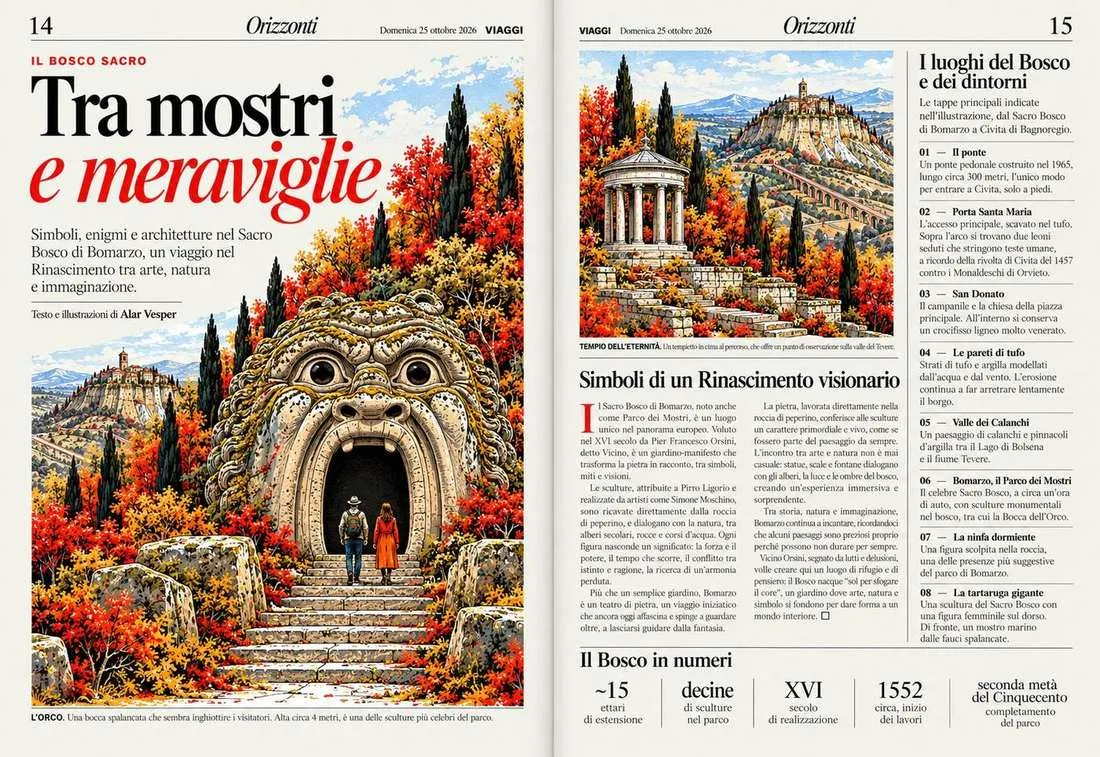
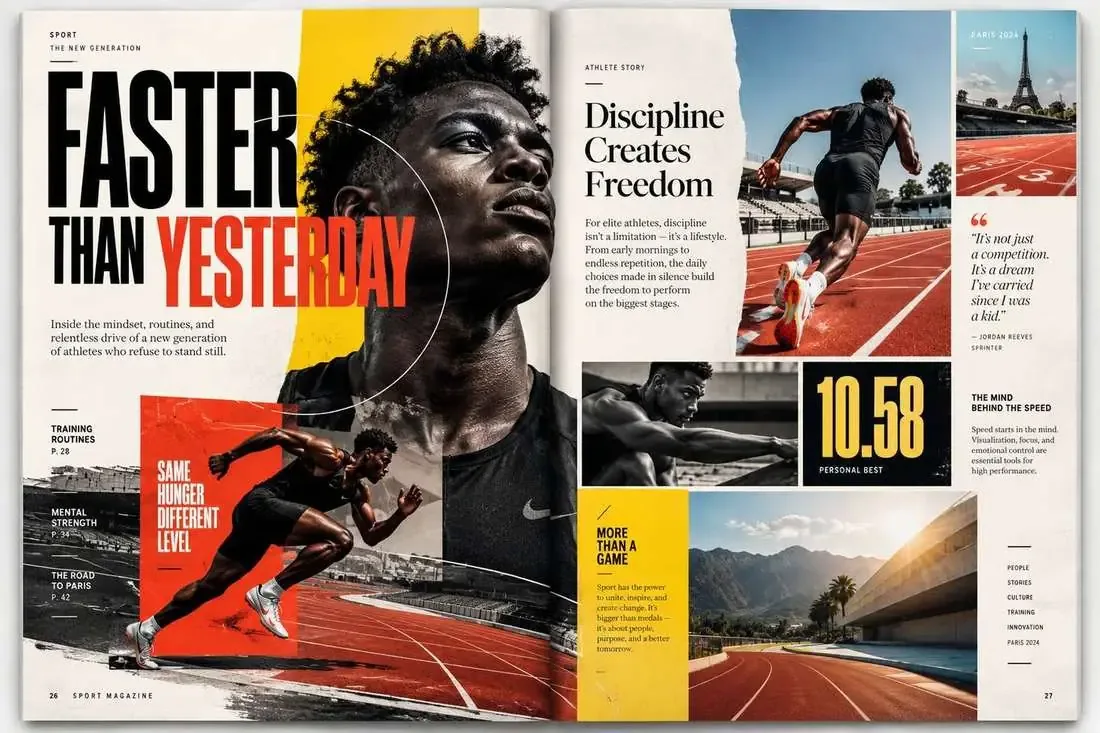
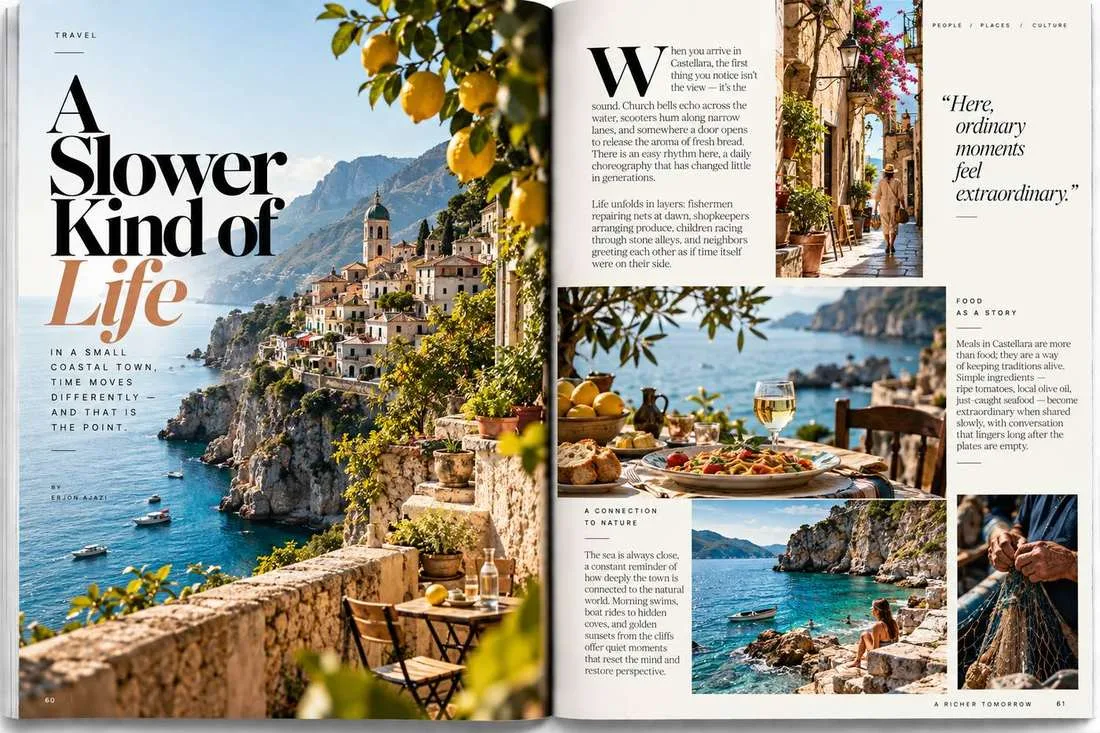
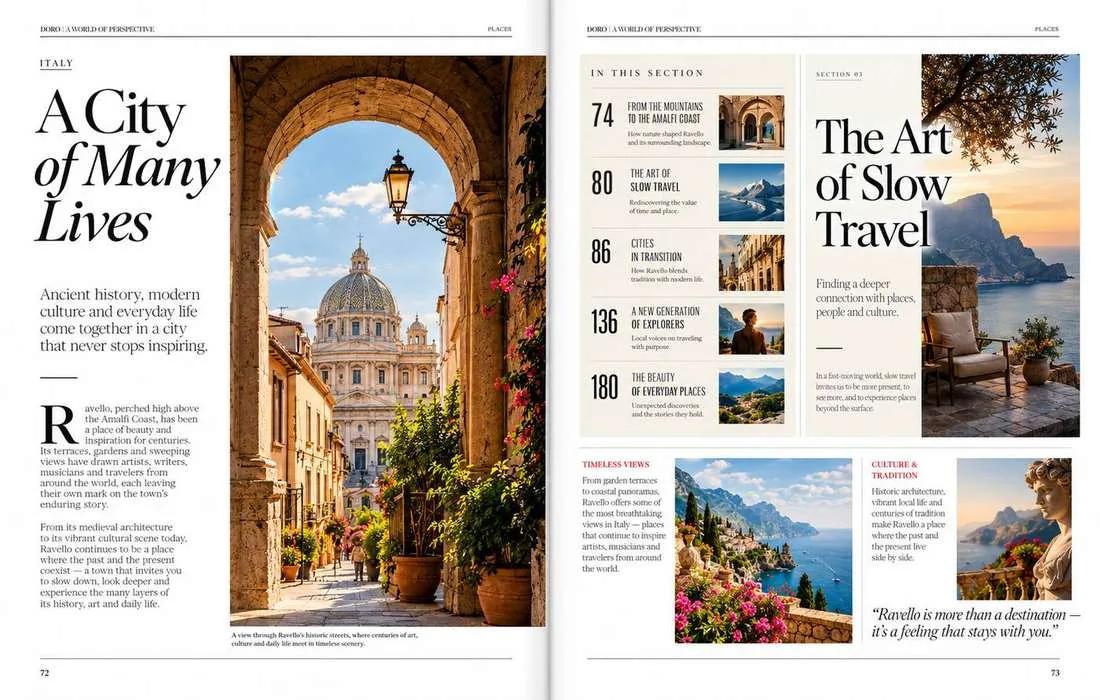
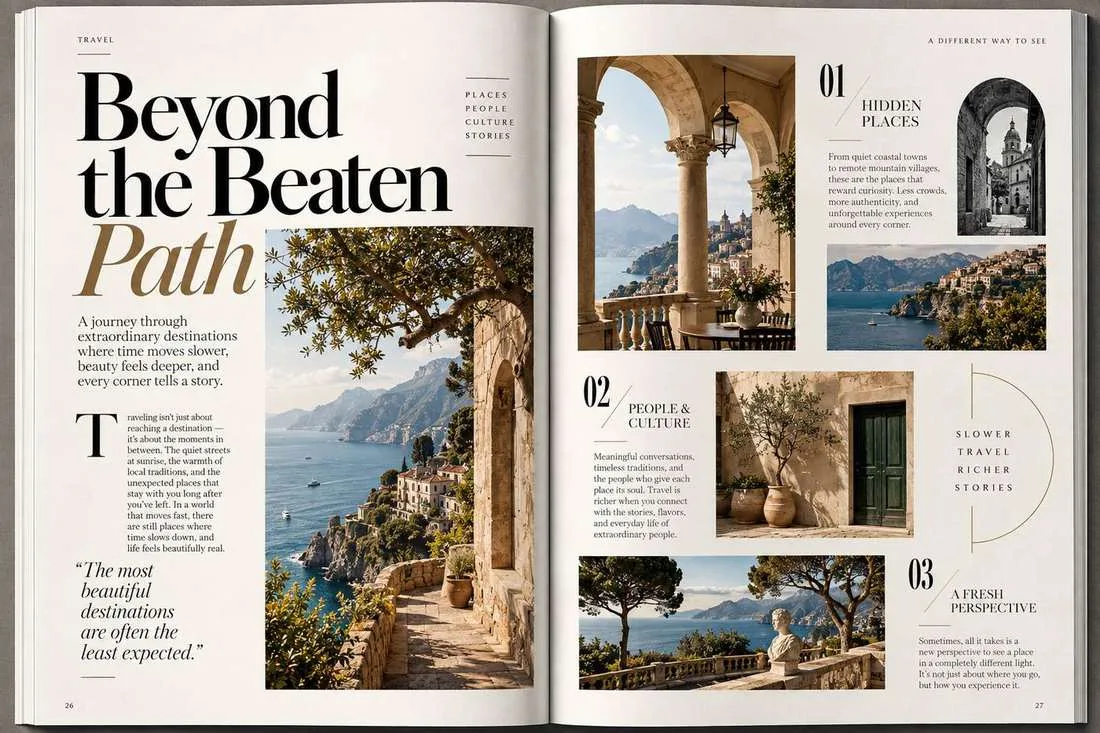
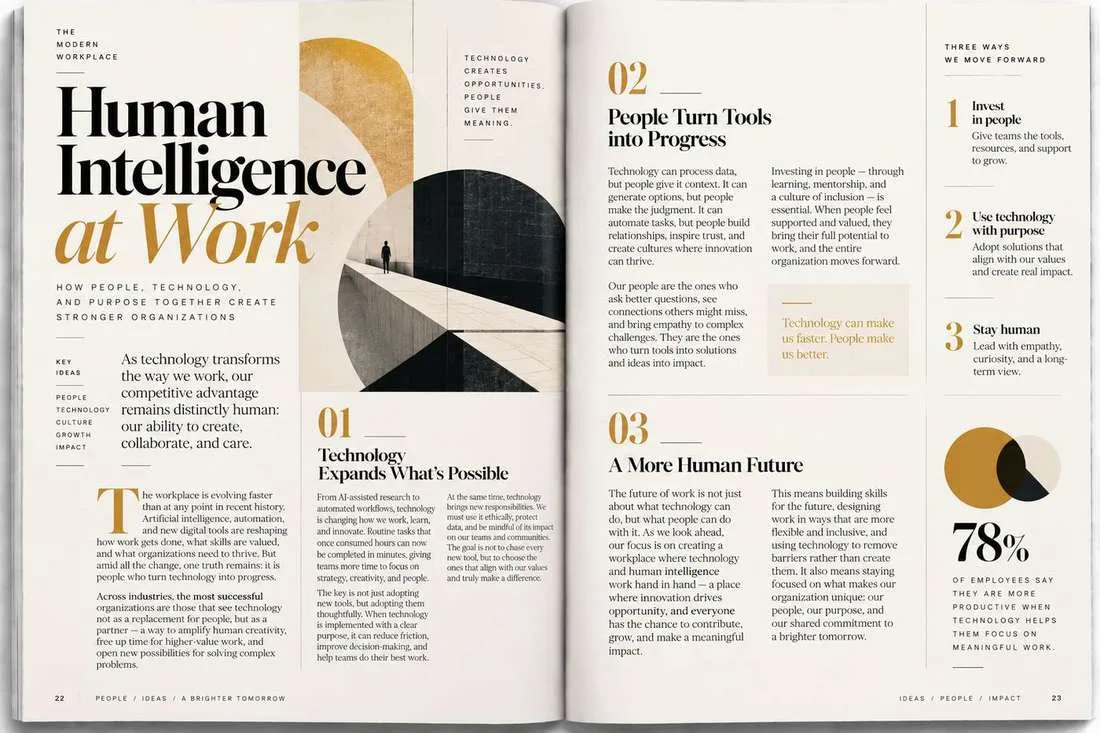
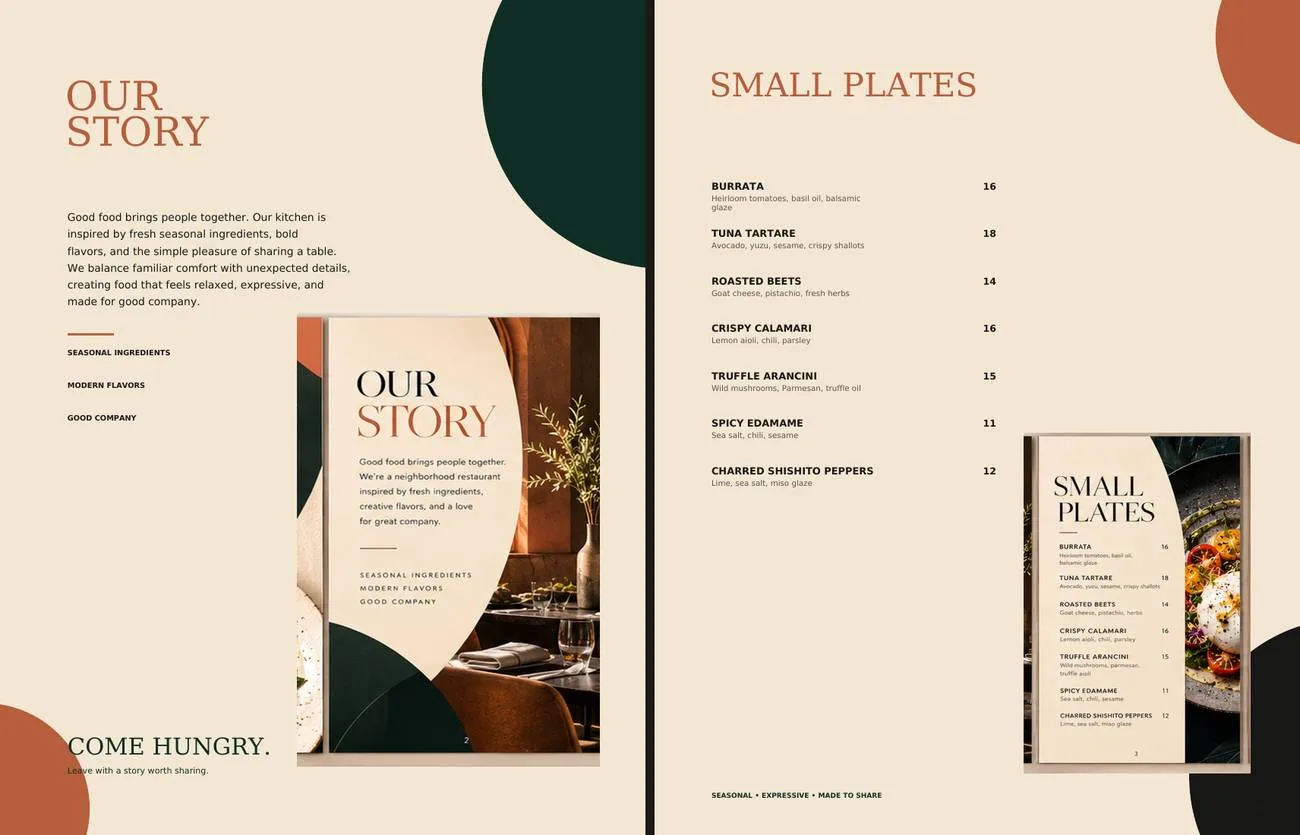
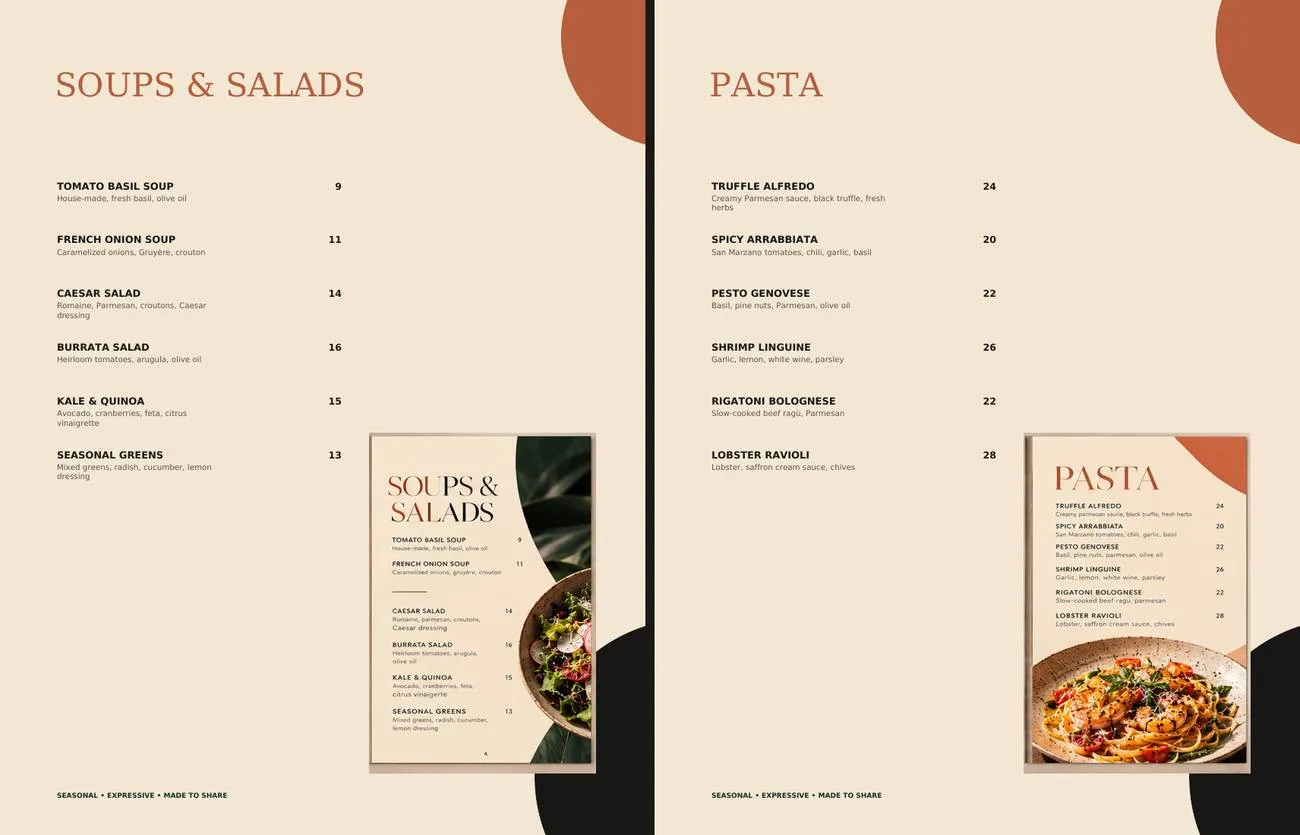
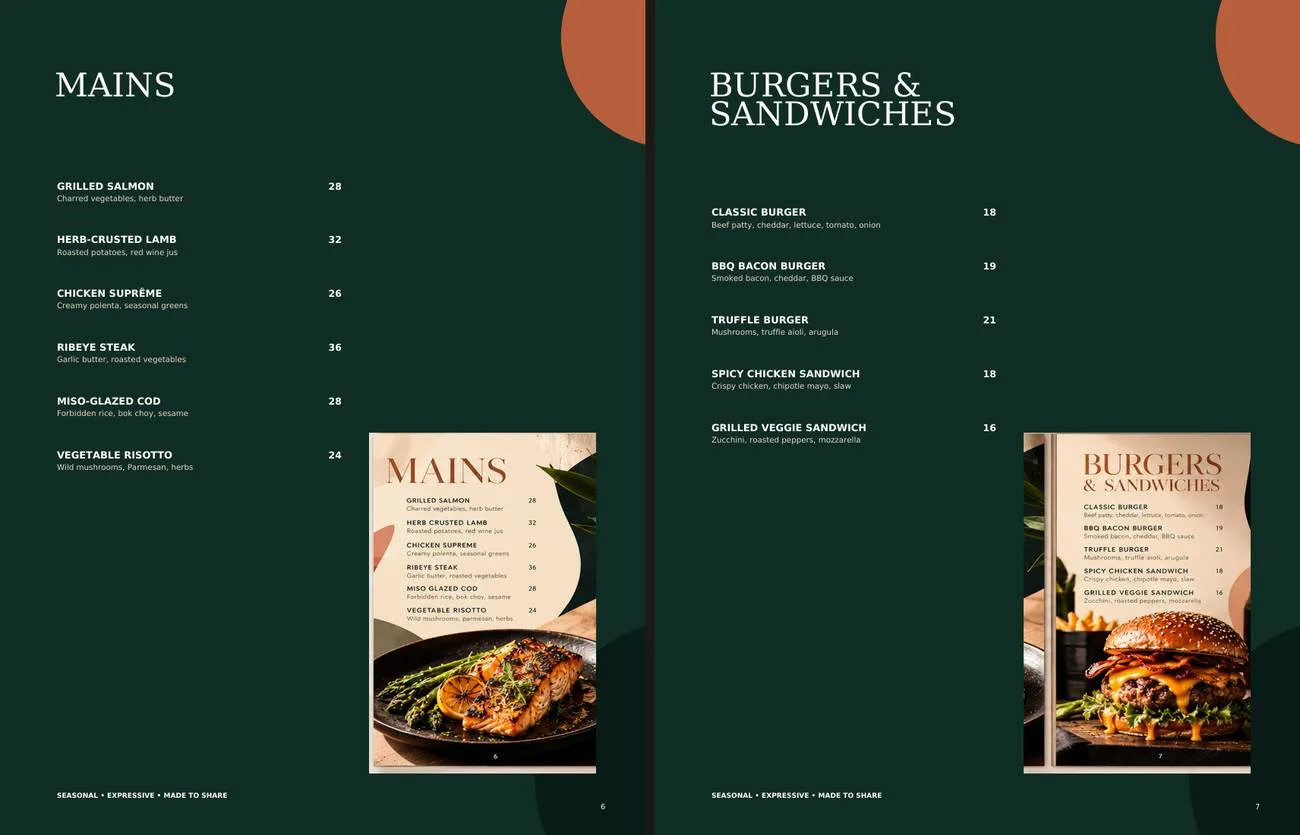
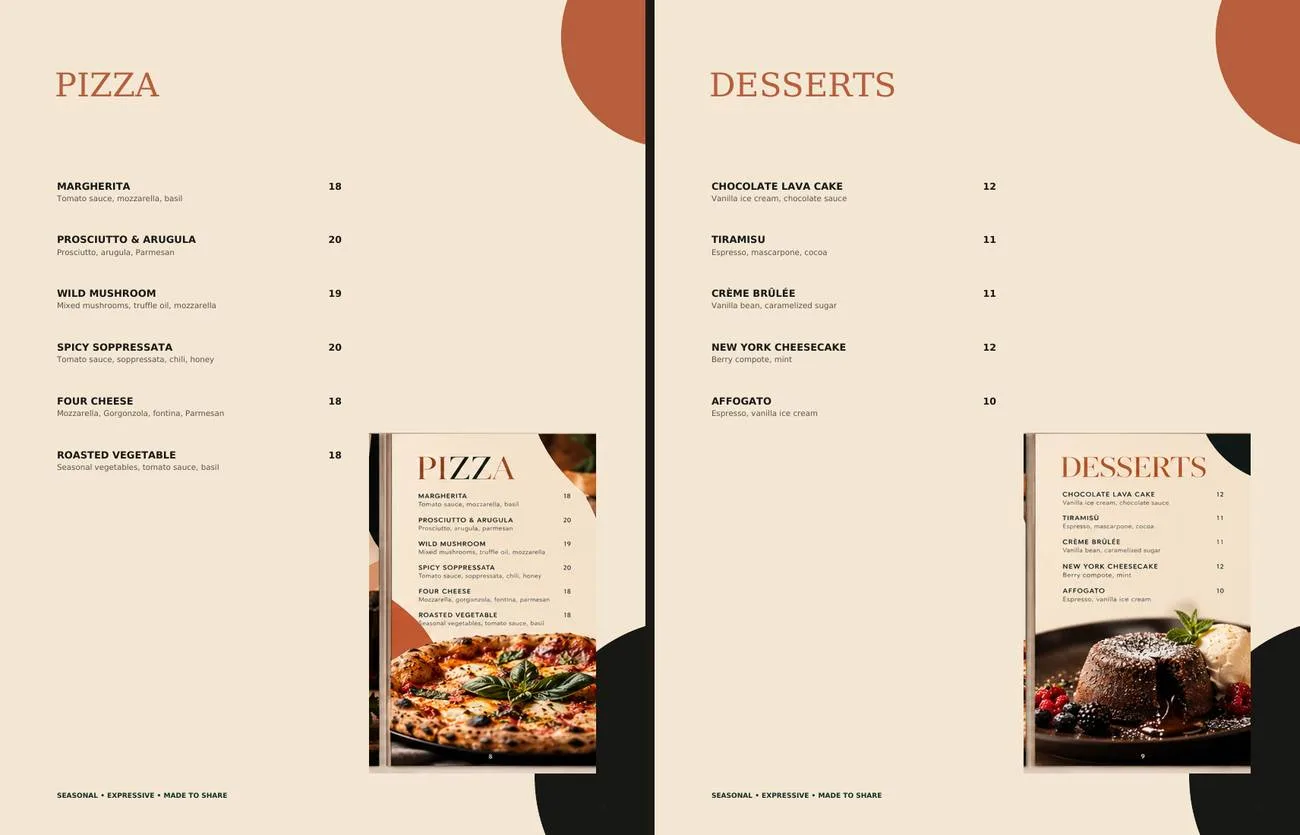

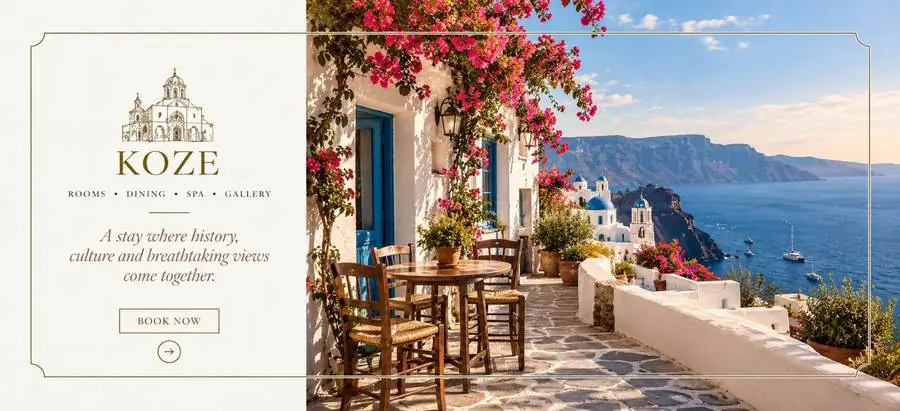
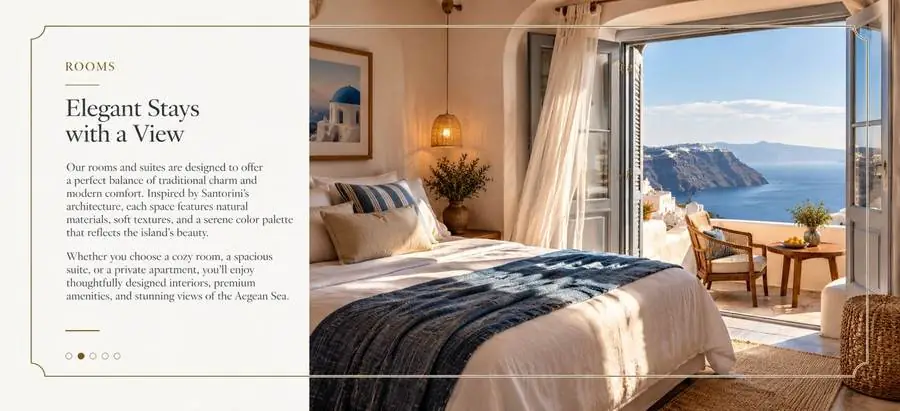
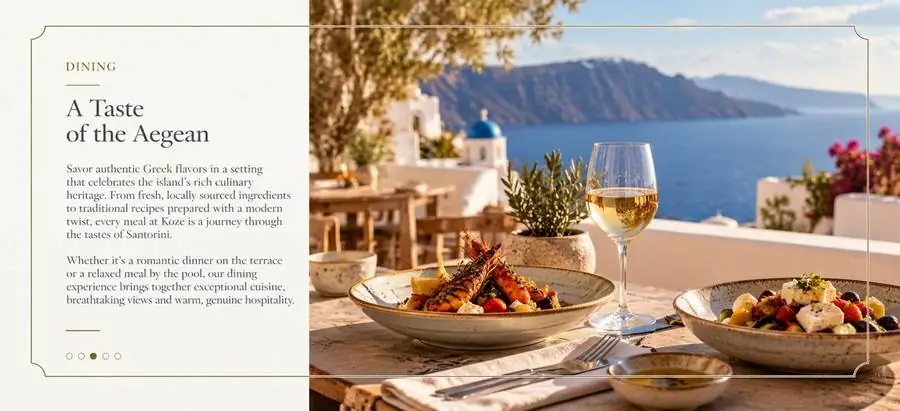
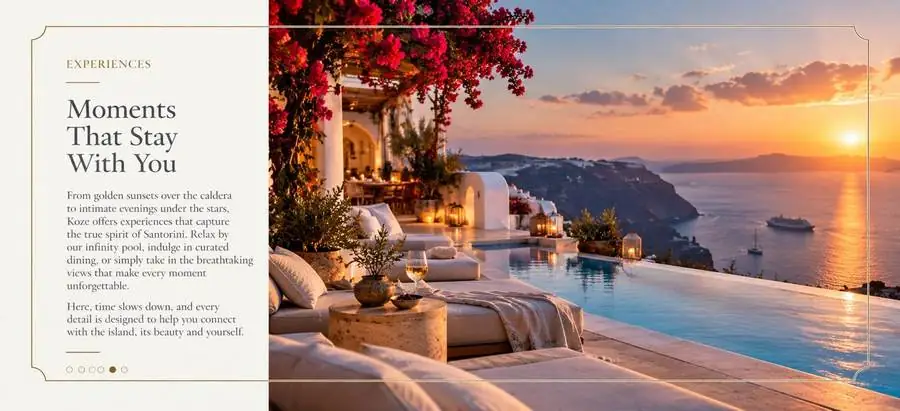
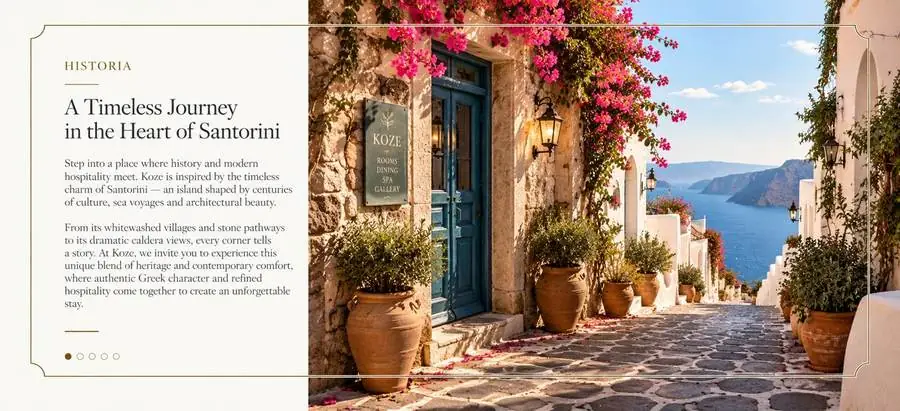
Hospitality · Boutique hotel website
Kozé, Santorini
Where history meets the view.
The pages
Rooms, dining, experiences and history, in one Aegean palette
NEXT MOCKUP
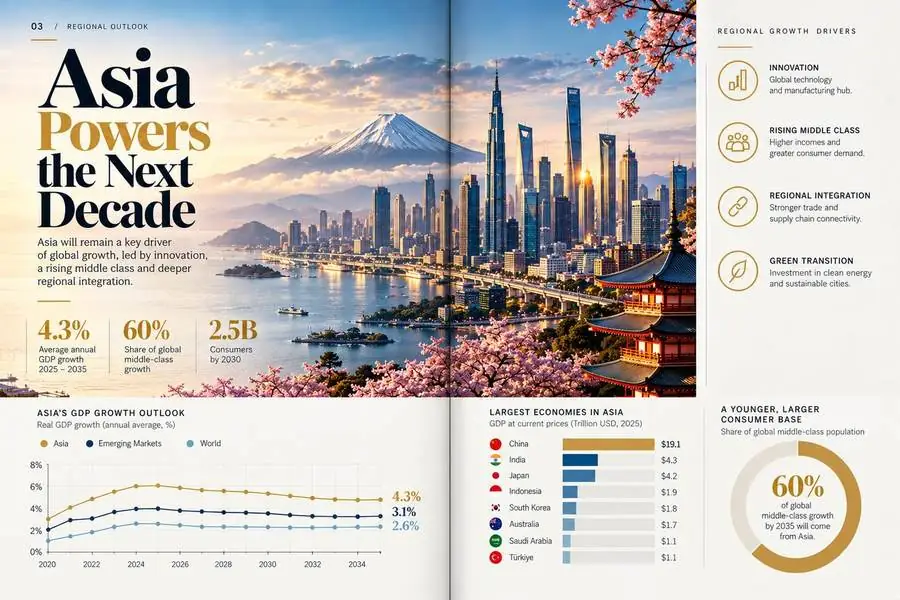
Garden City Florist Want one like this? Let’s talkA More Multipolar World
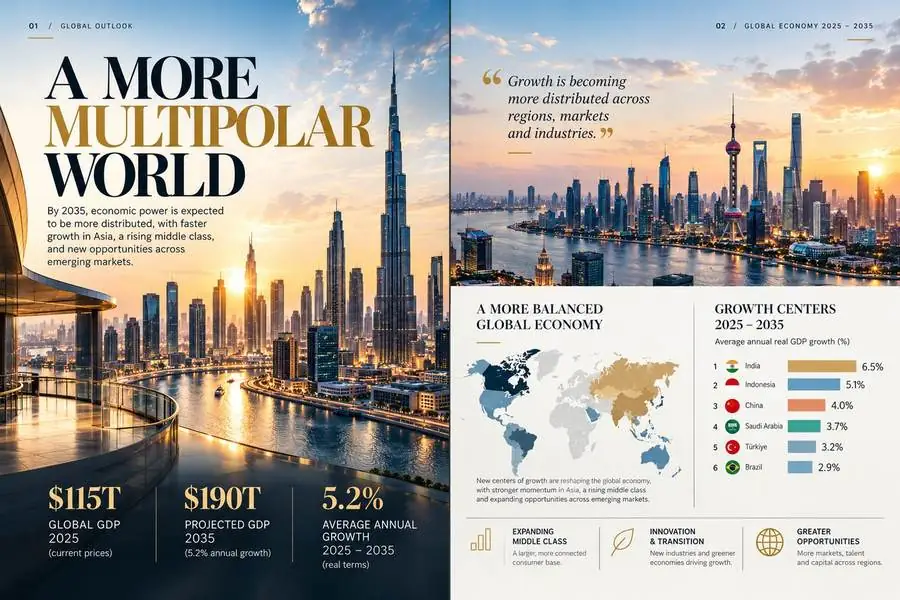
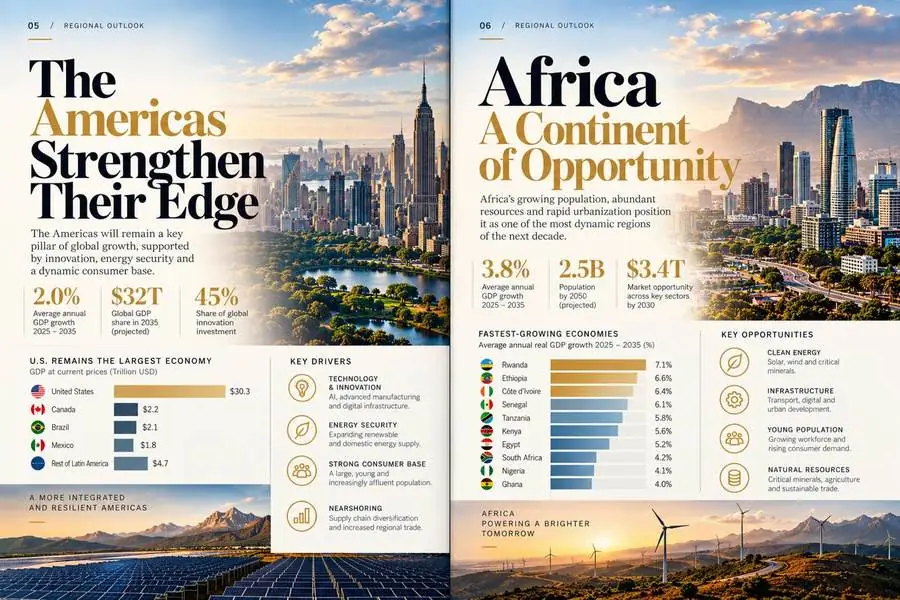
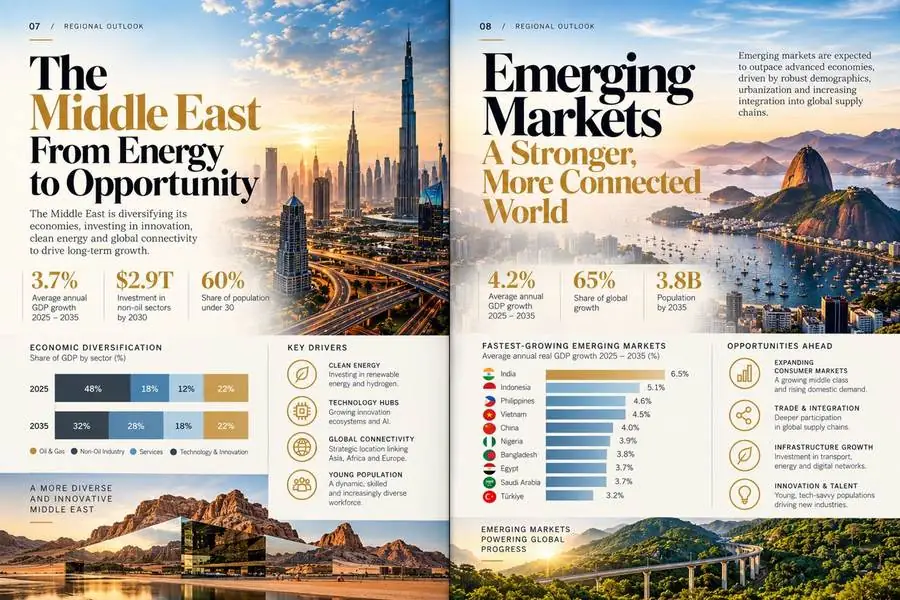
An eight-page global economic outlook for 2025–2035. Editorial spreads pair skyline photography with clear data: GDP projections, regional growth rankings and the forces driving them, region by region.
Every spread follows one system: a bold serif headline in navy and gold, three key figures, then charts and icons that explain what drives growth. The structure stays the same from region to region, so readers can compare at a glance.
Presentation design
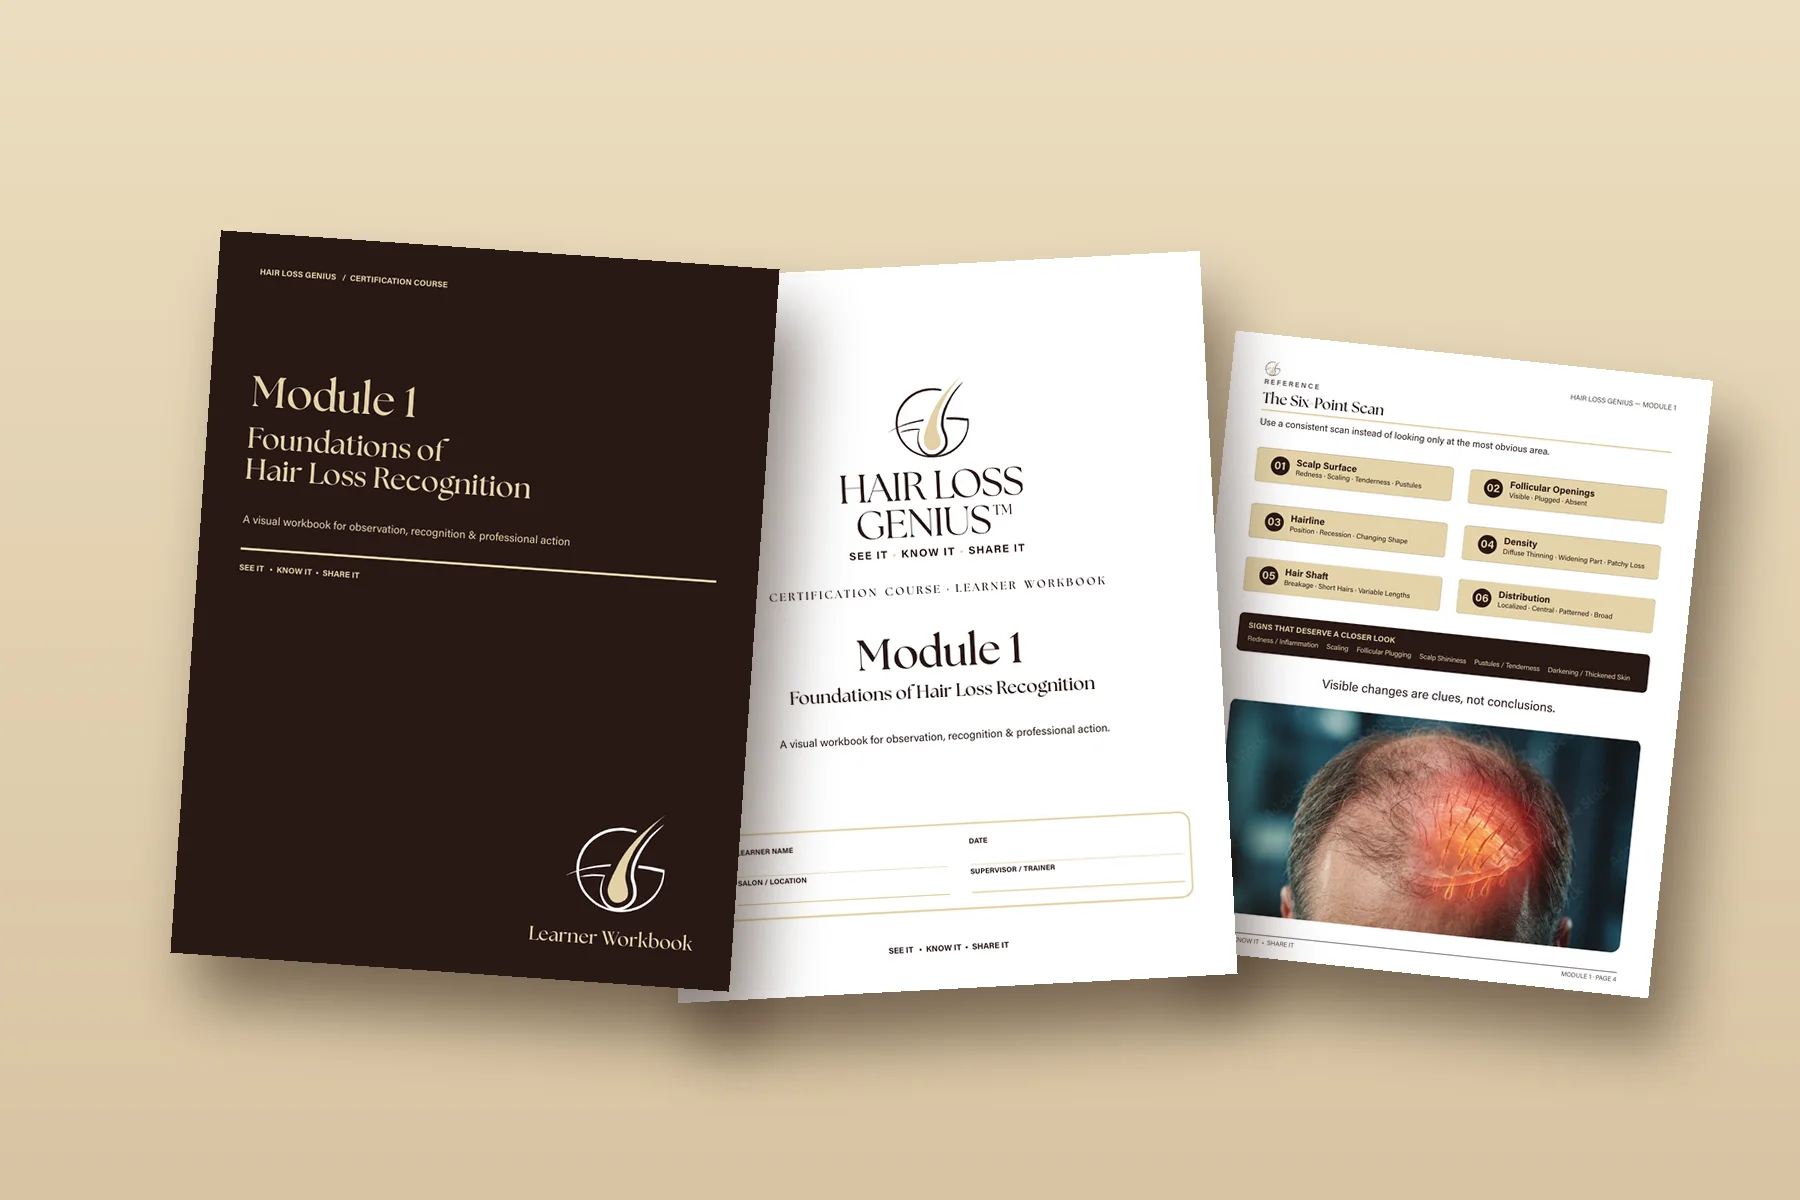
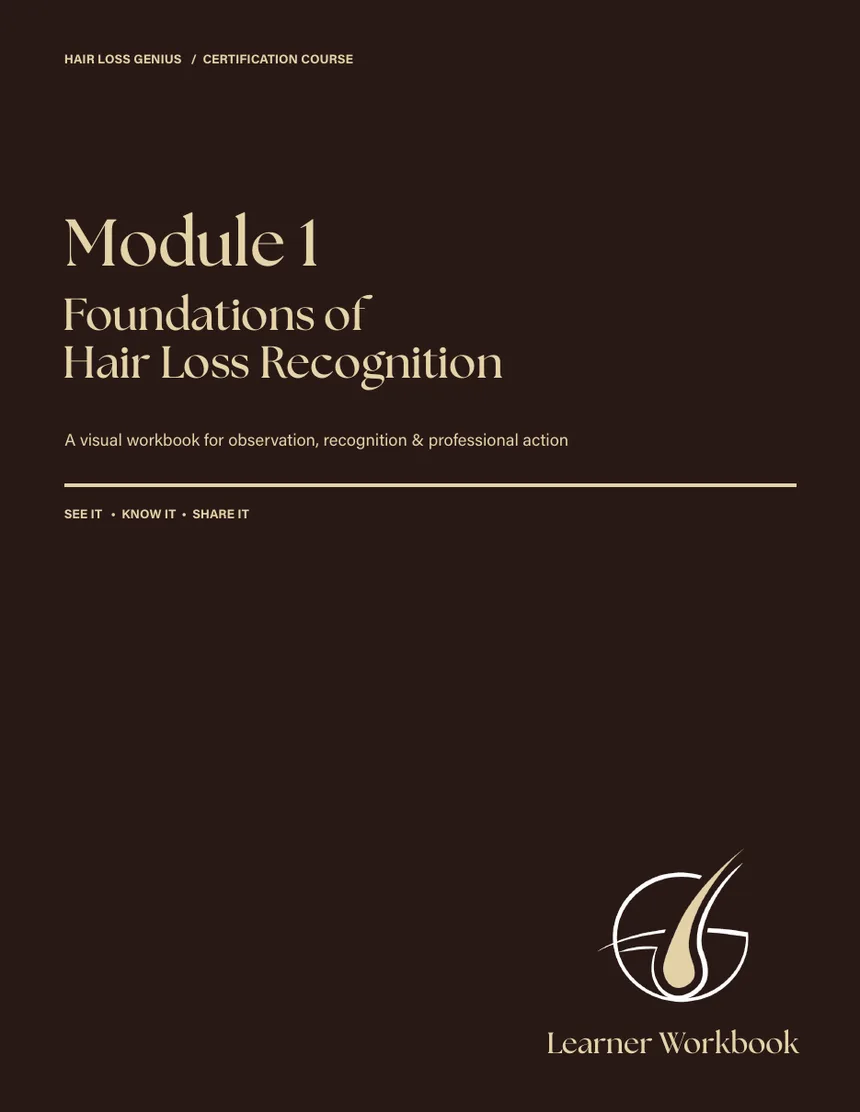
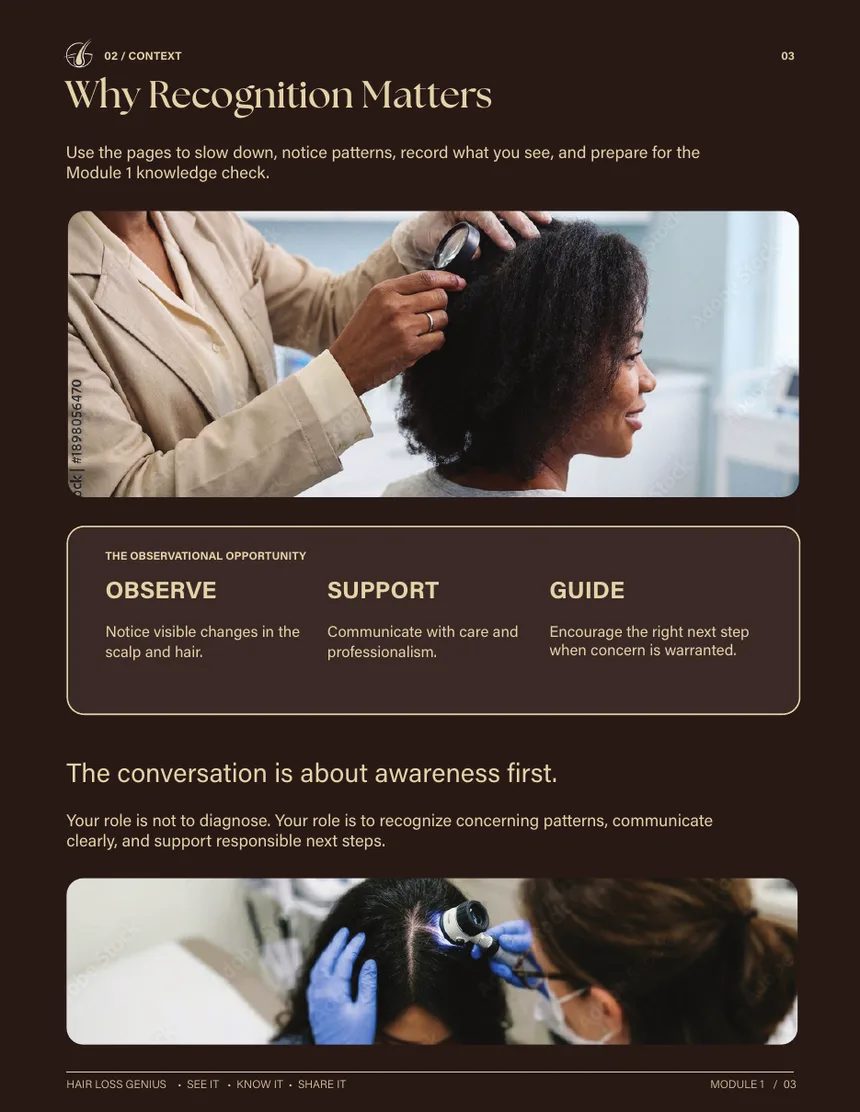
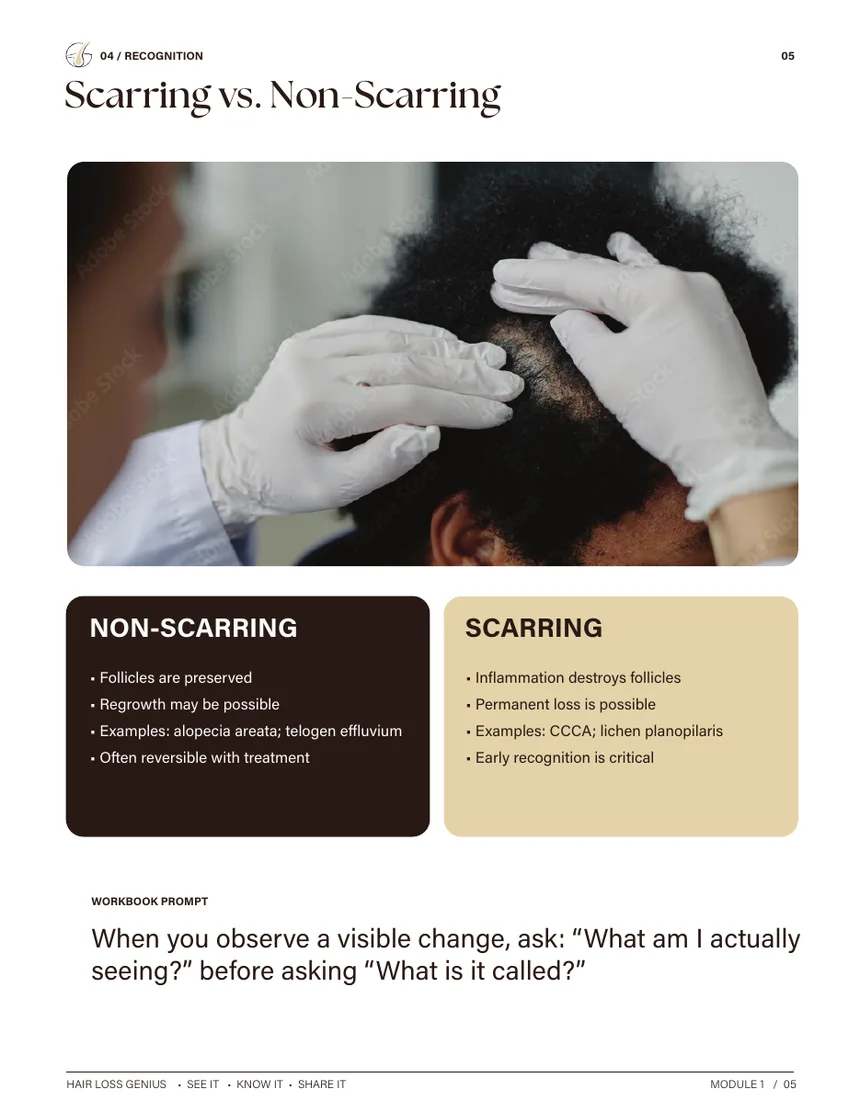
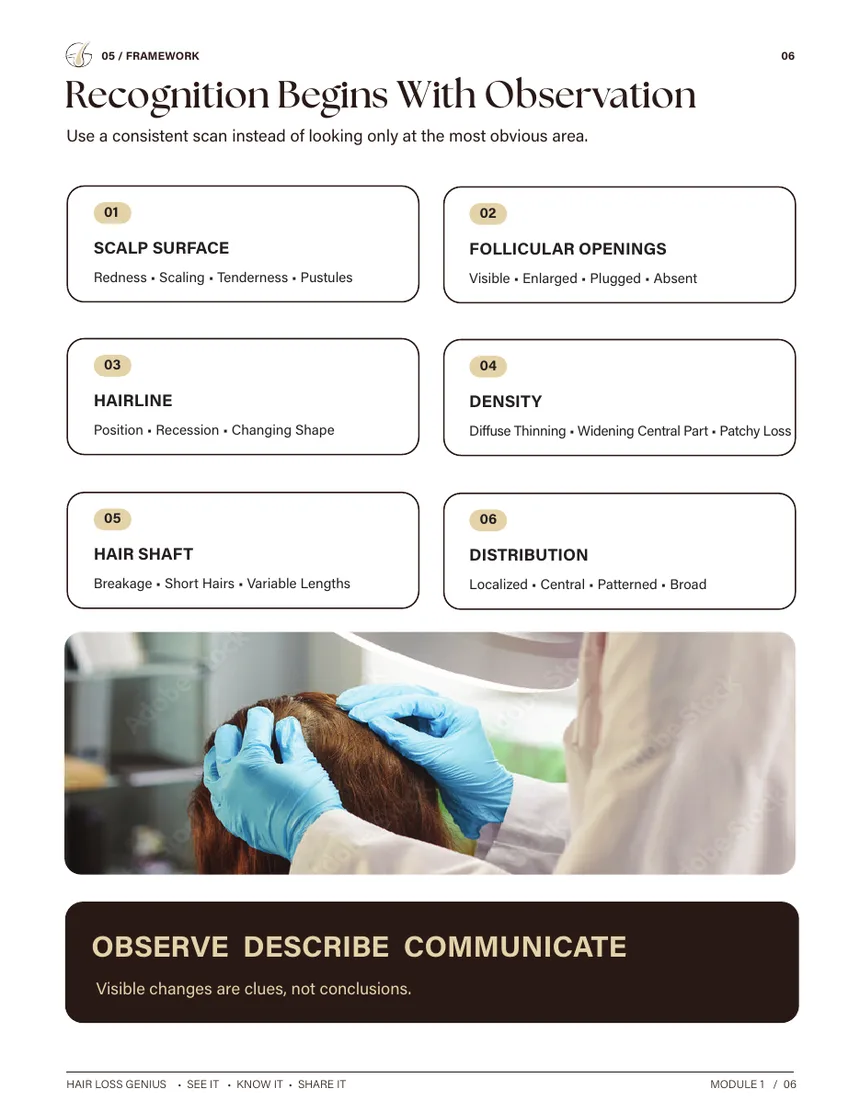
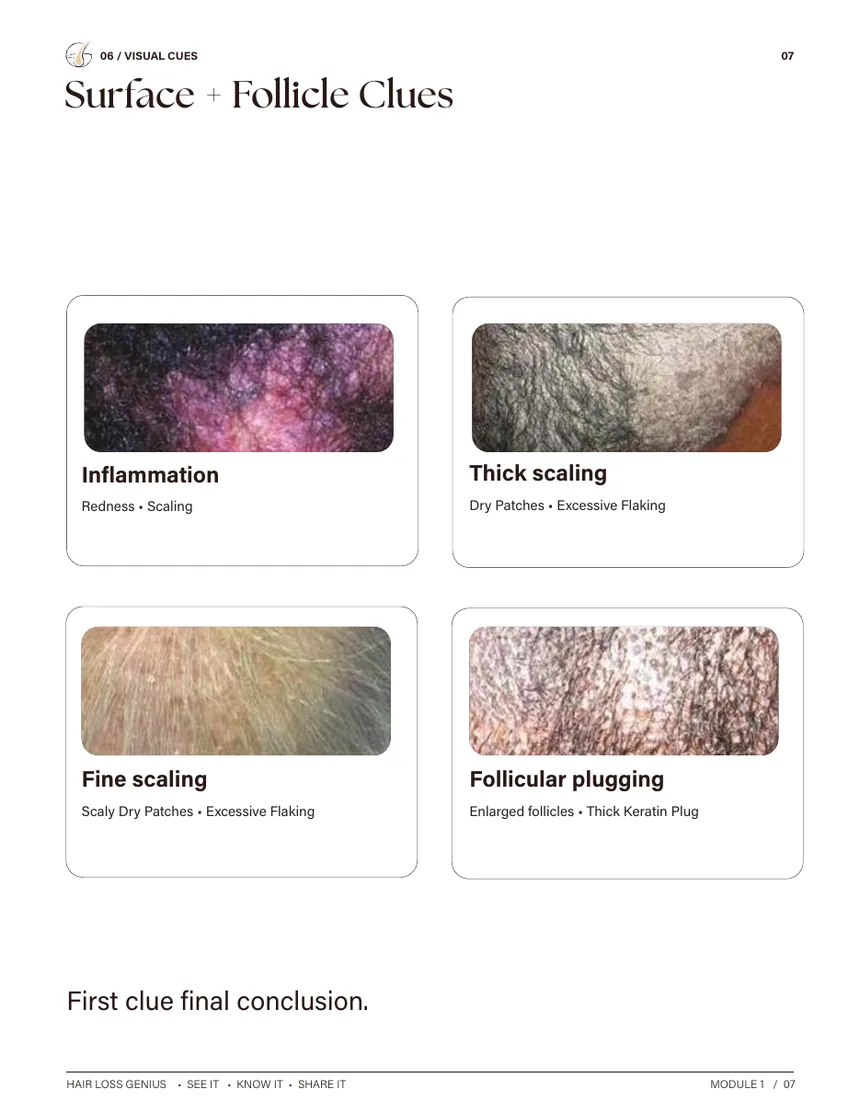
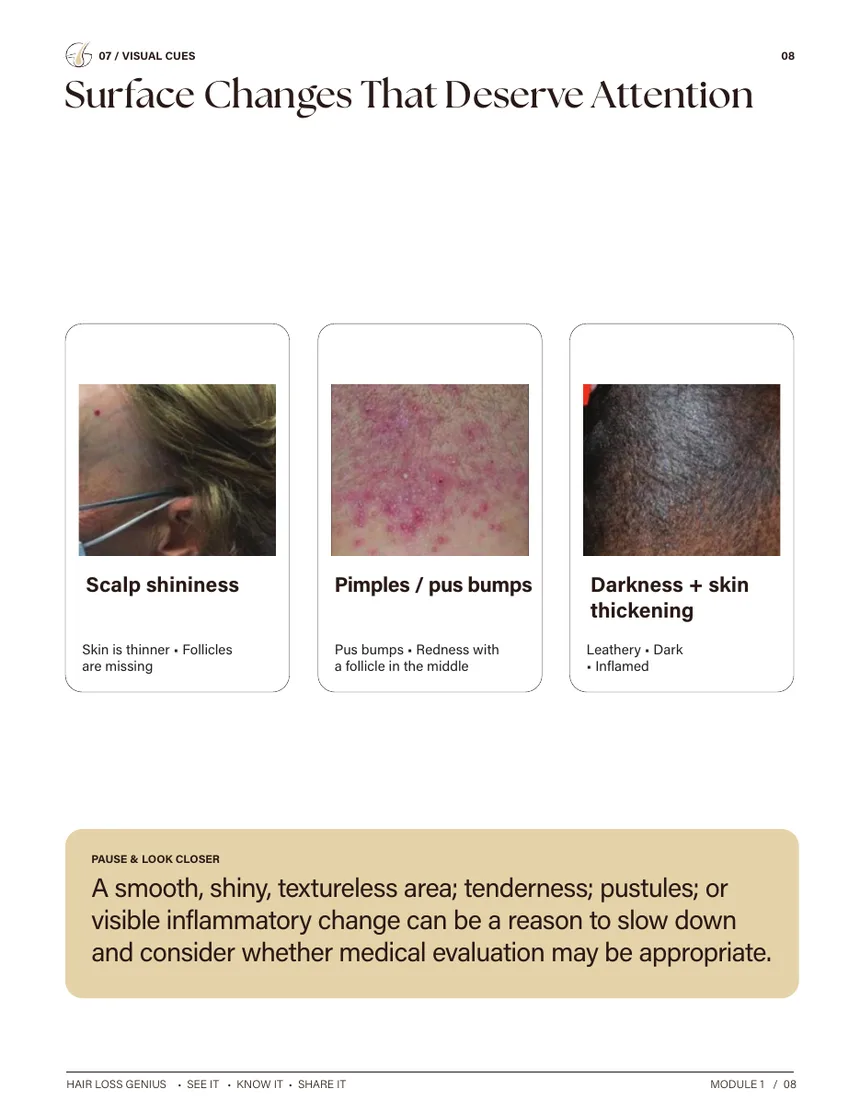
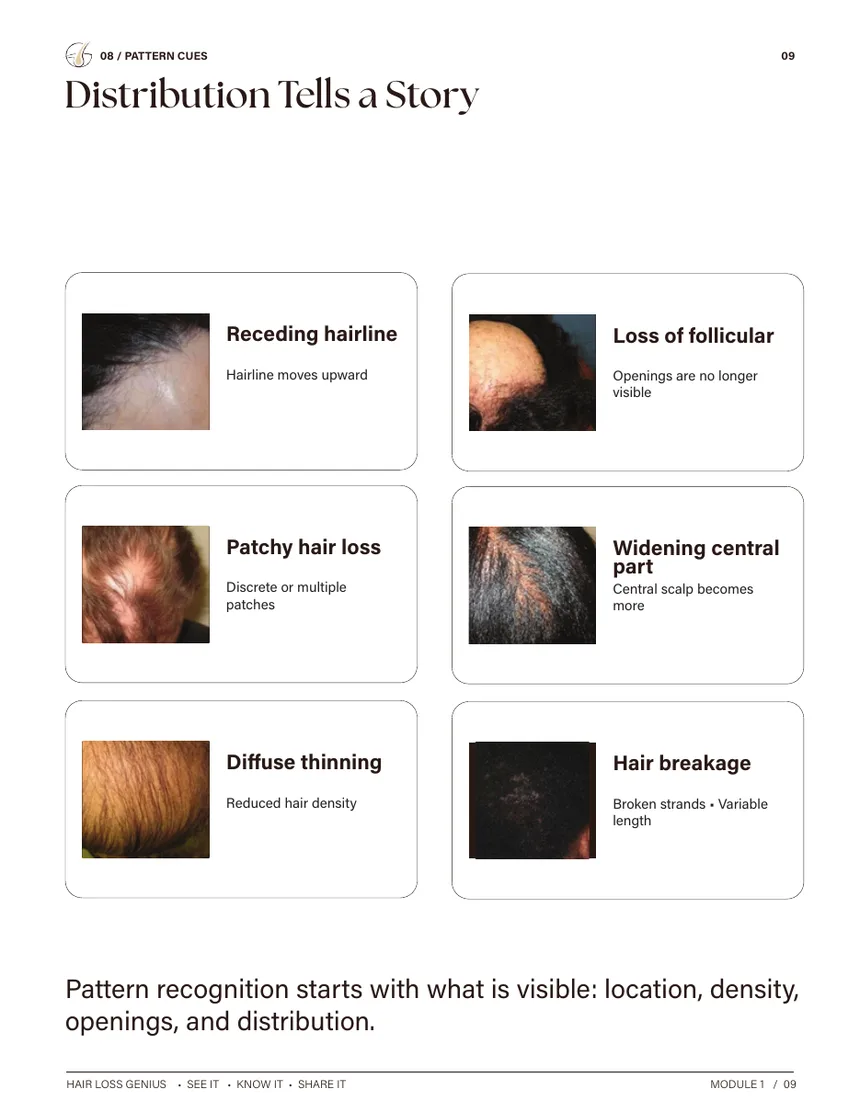
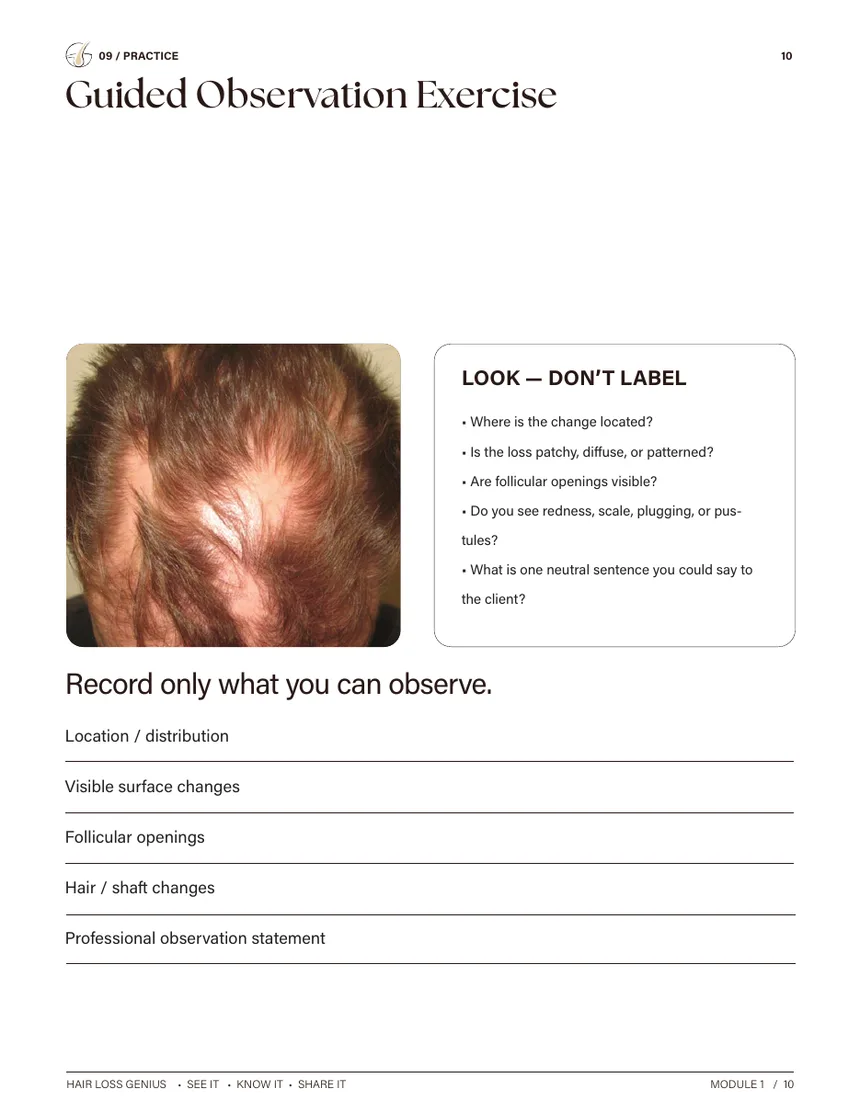
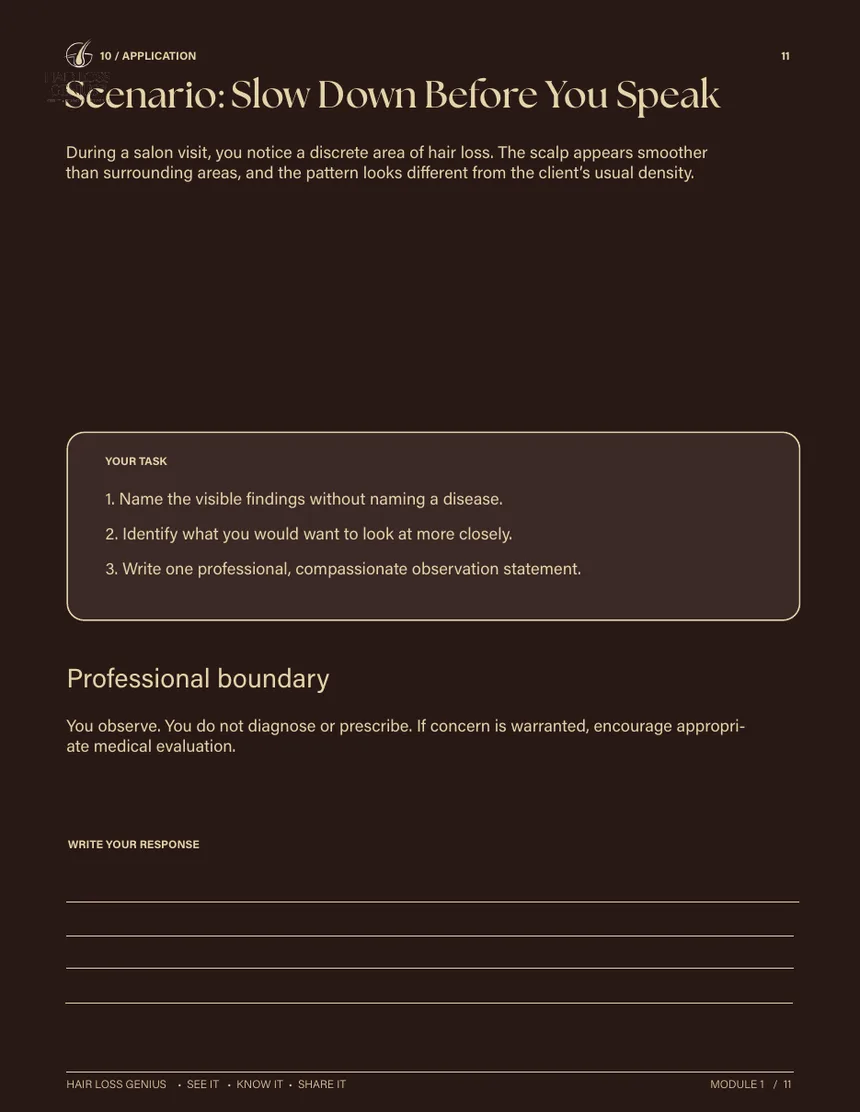
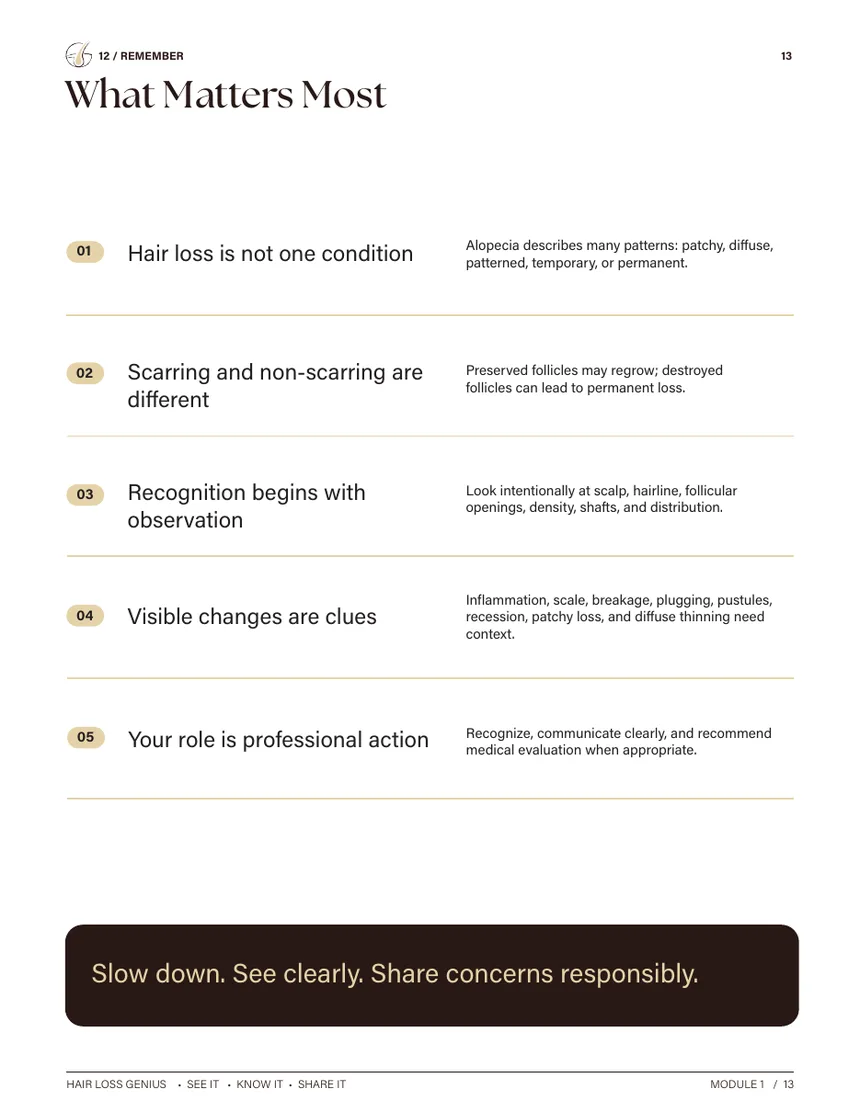
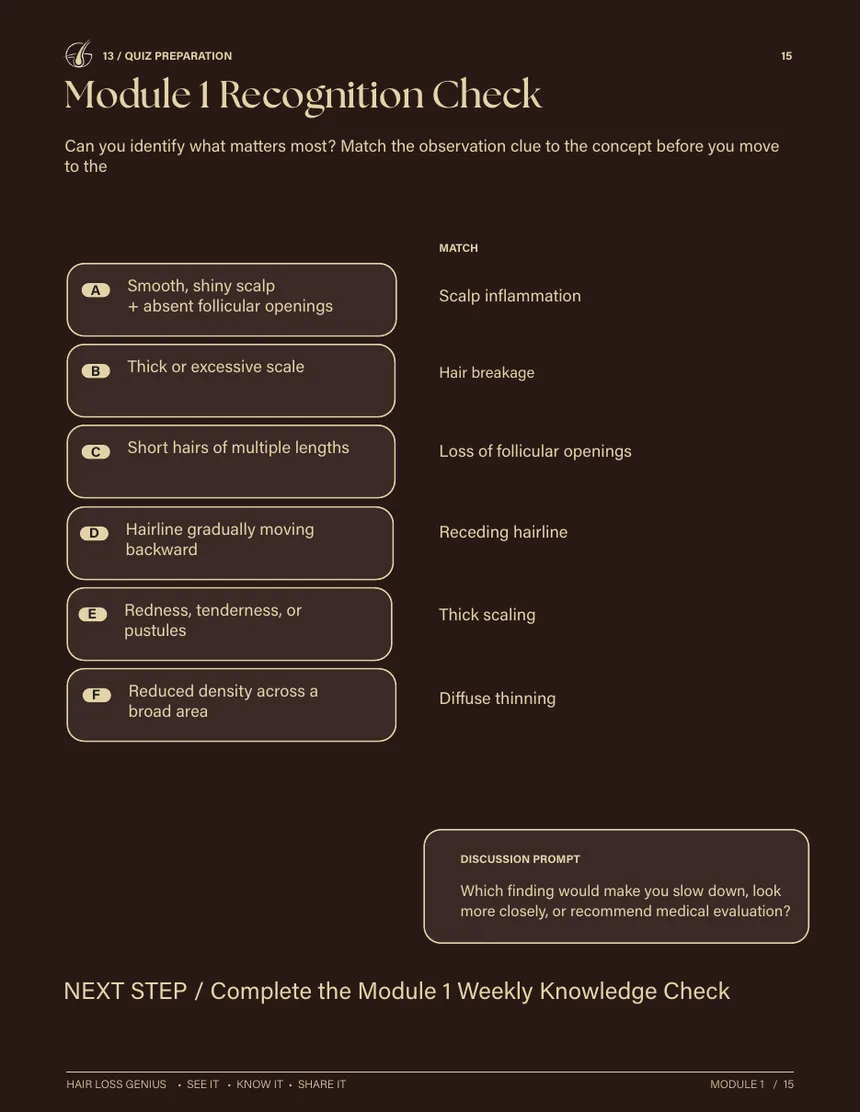
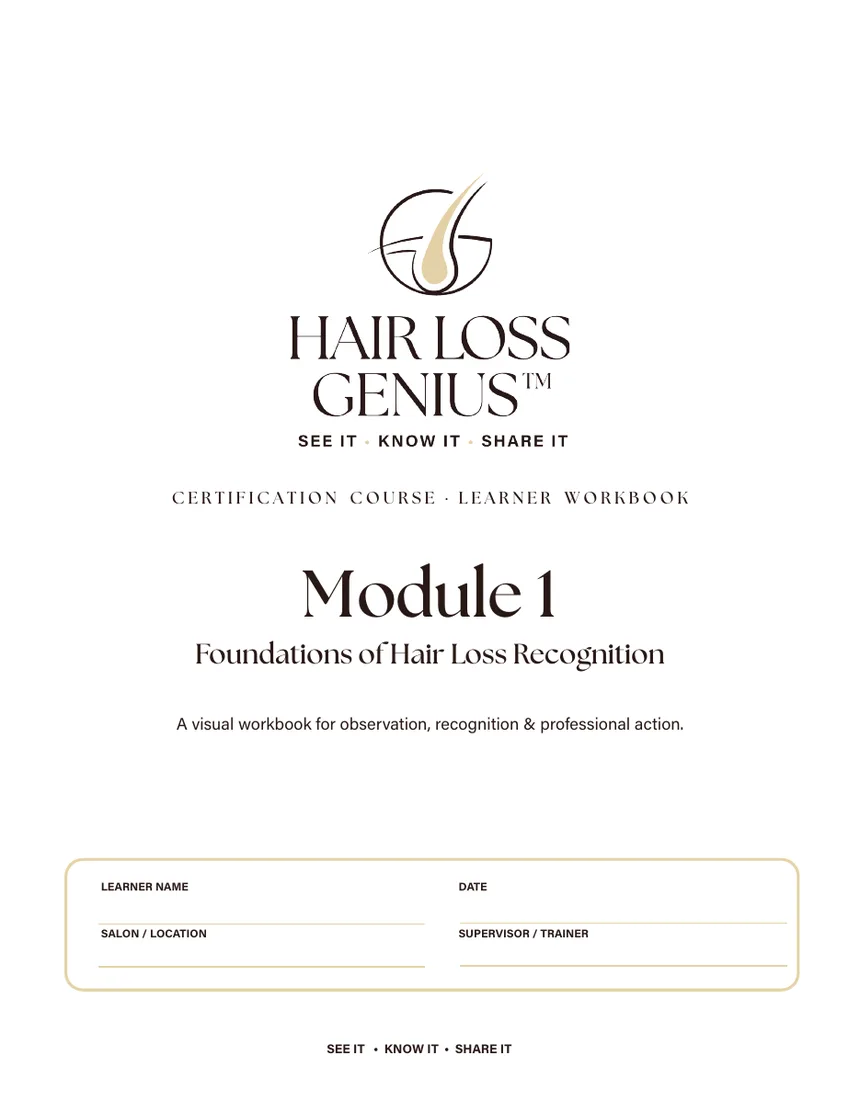
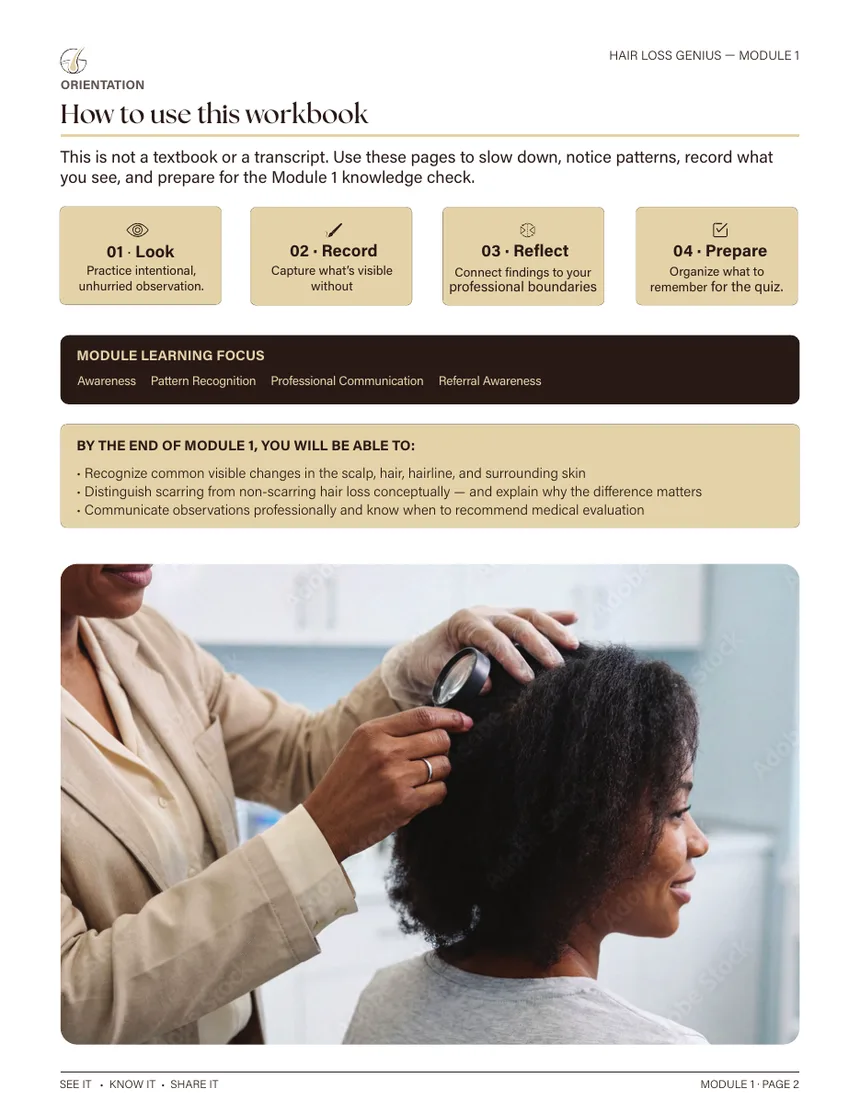
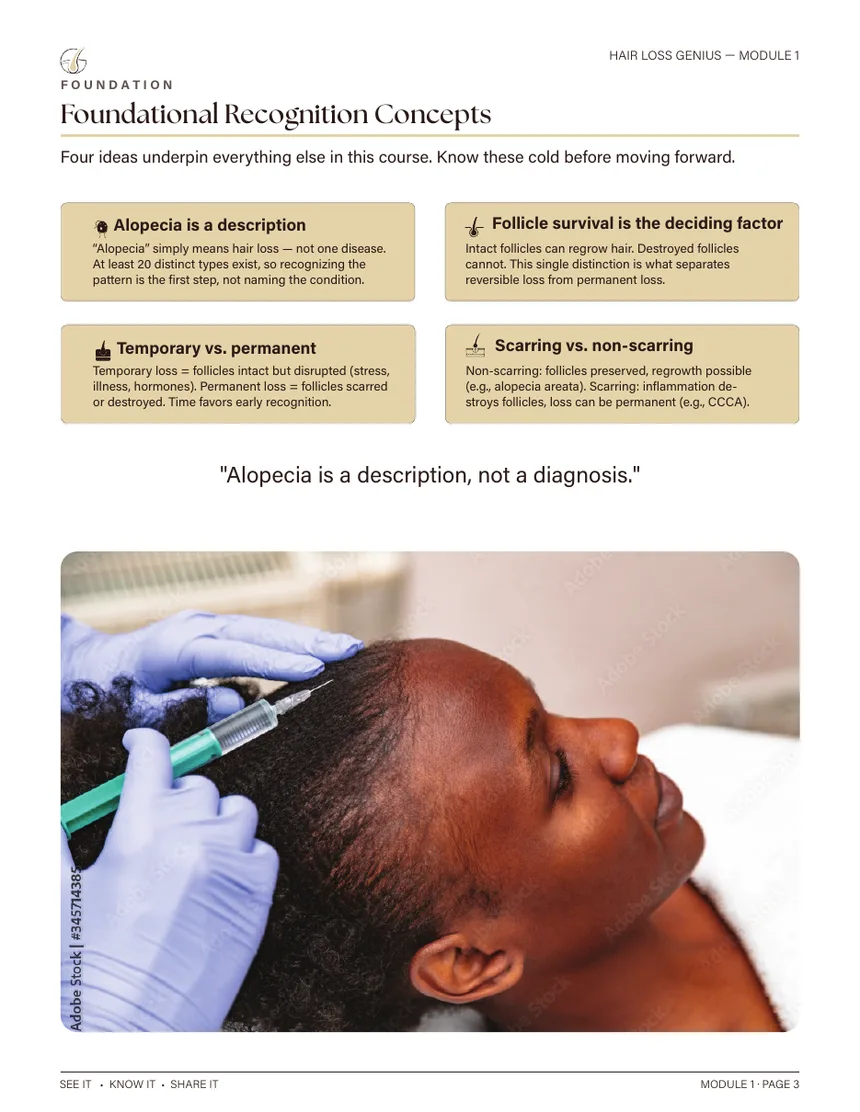
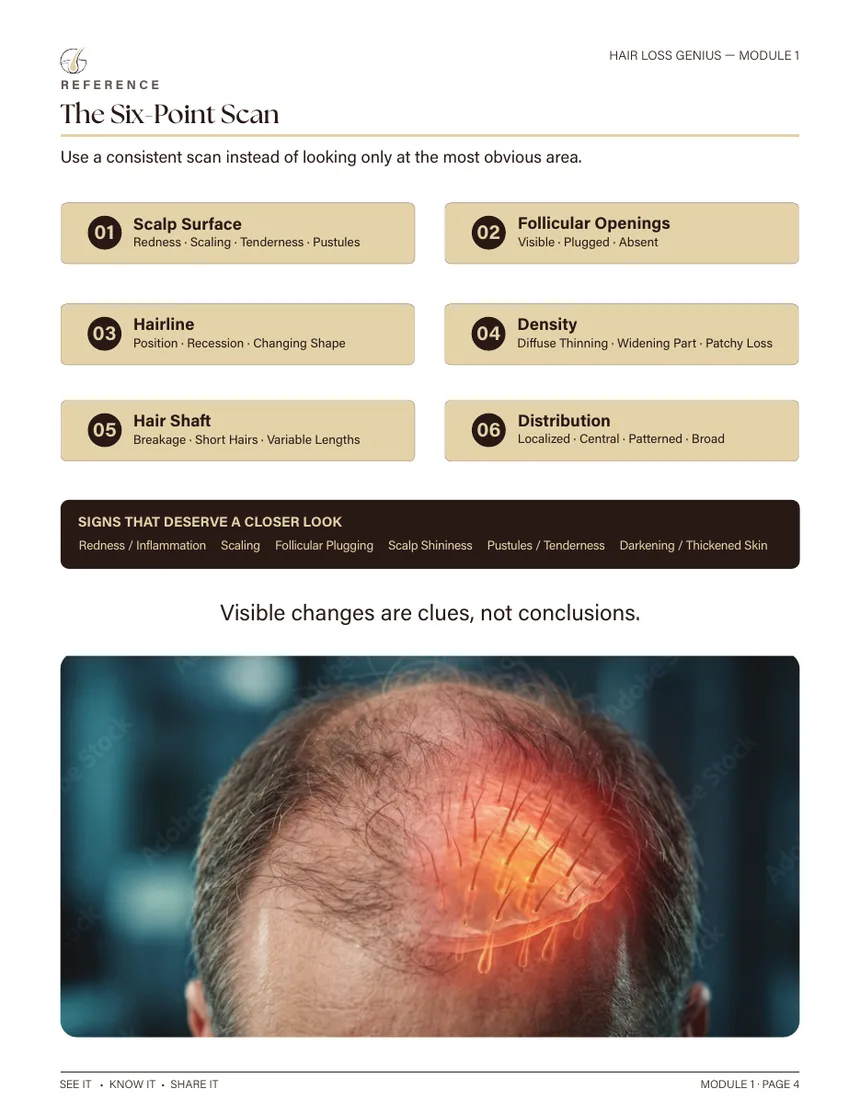
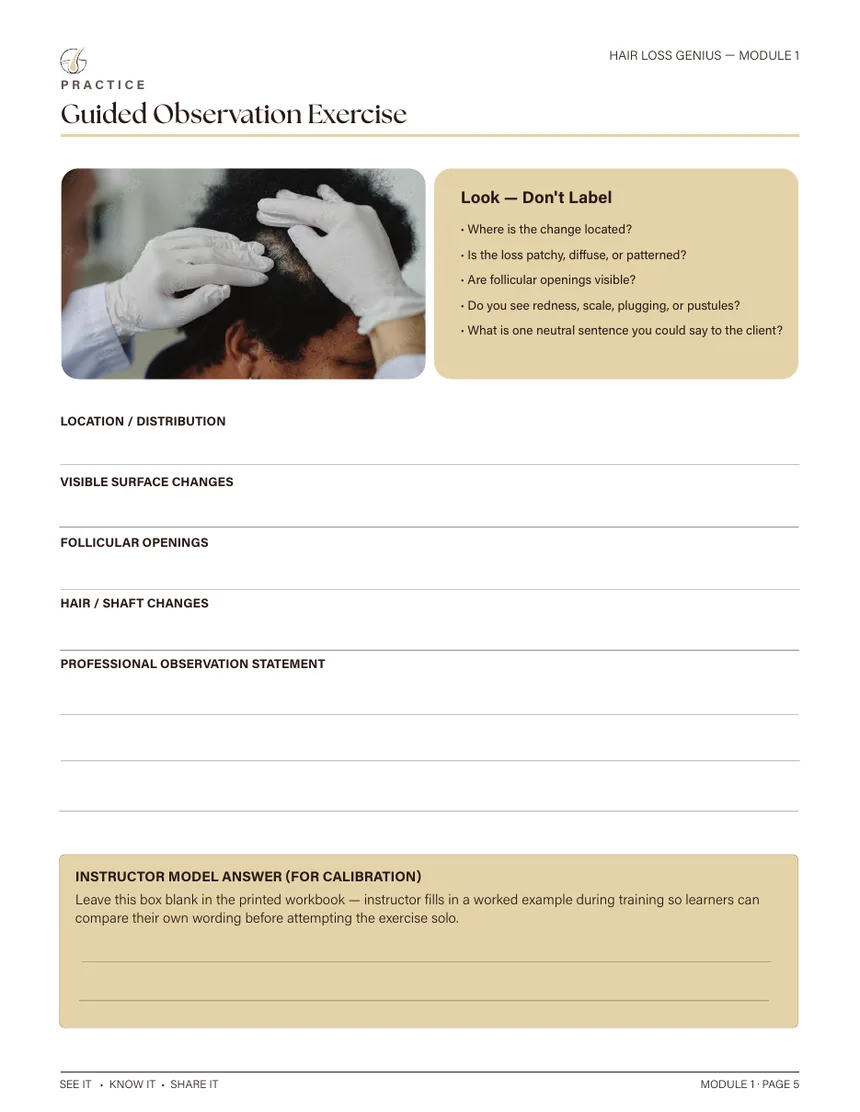
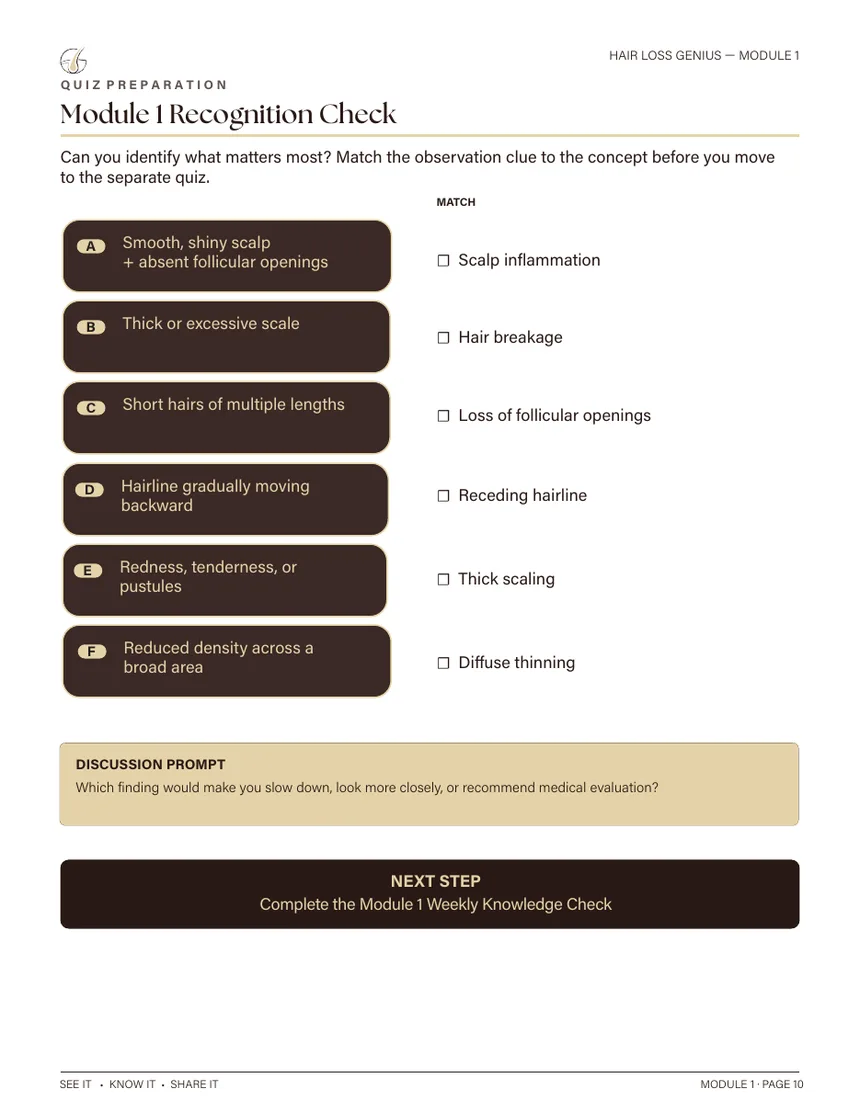
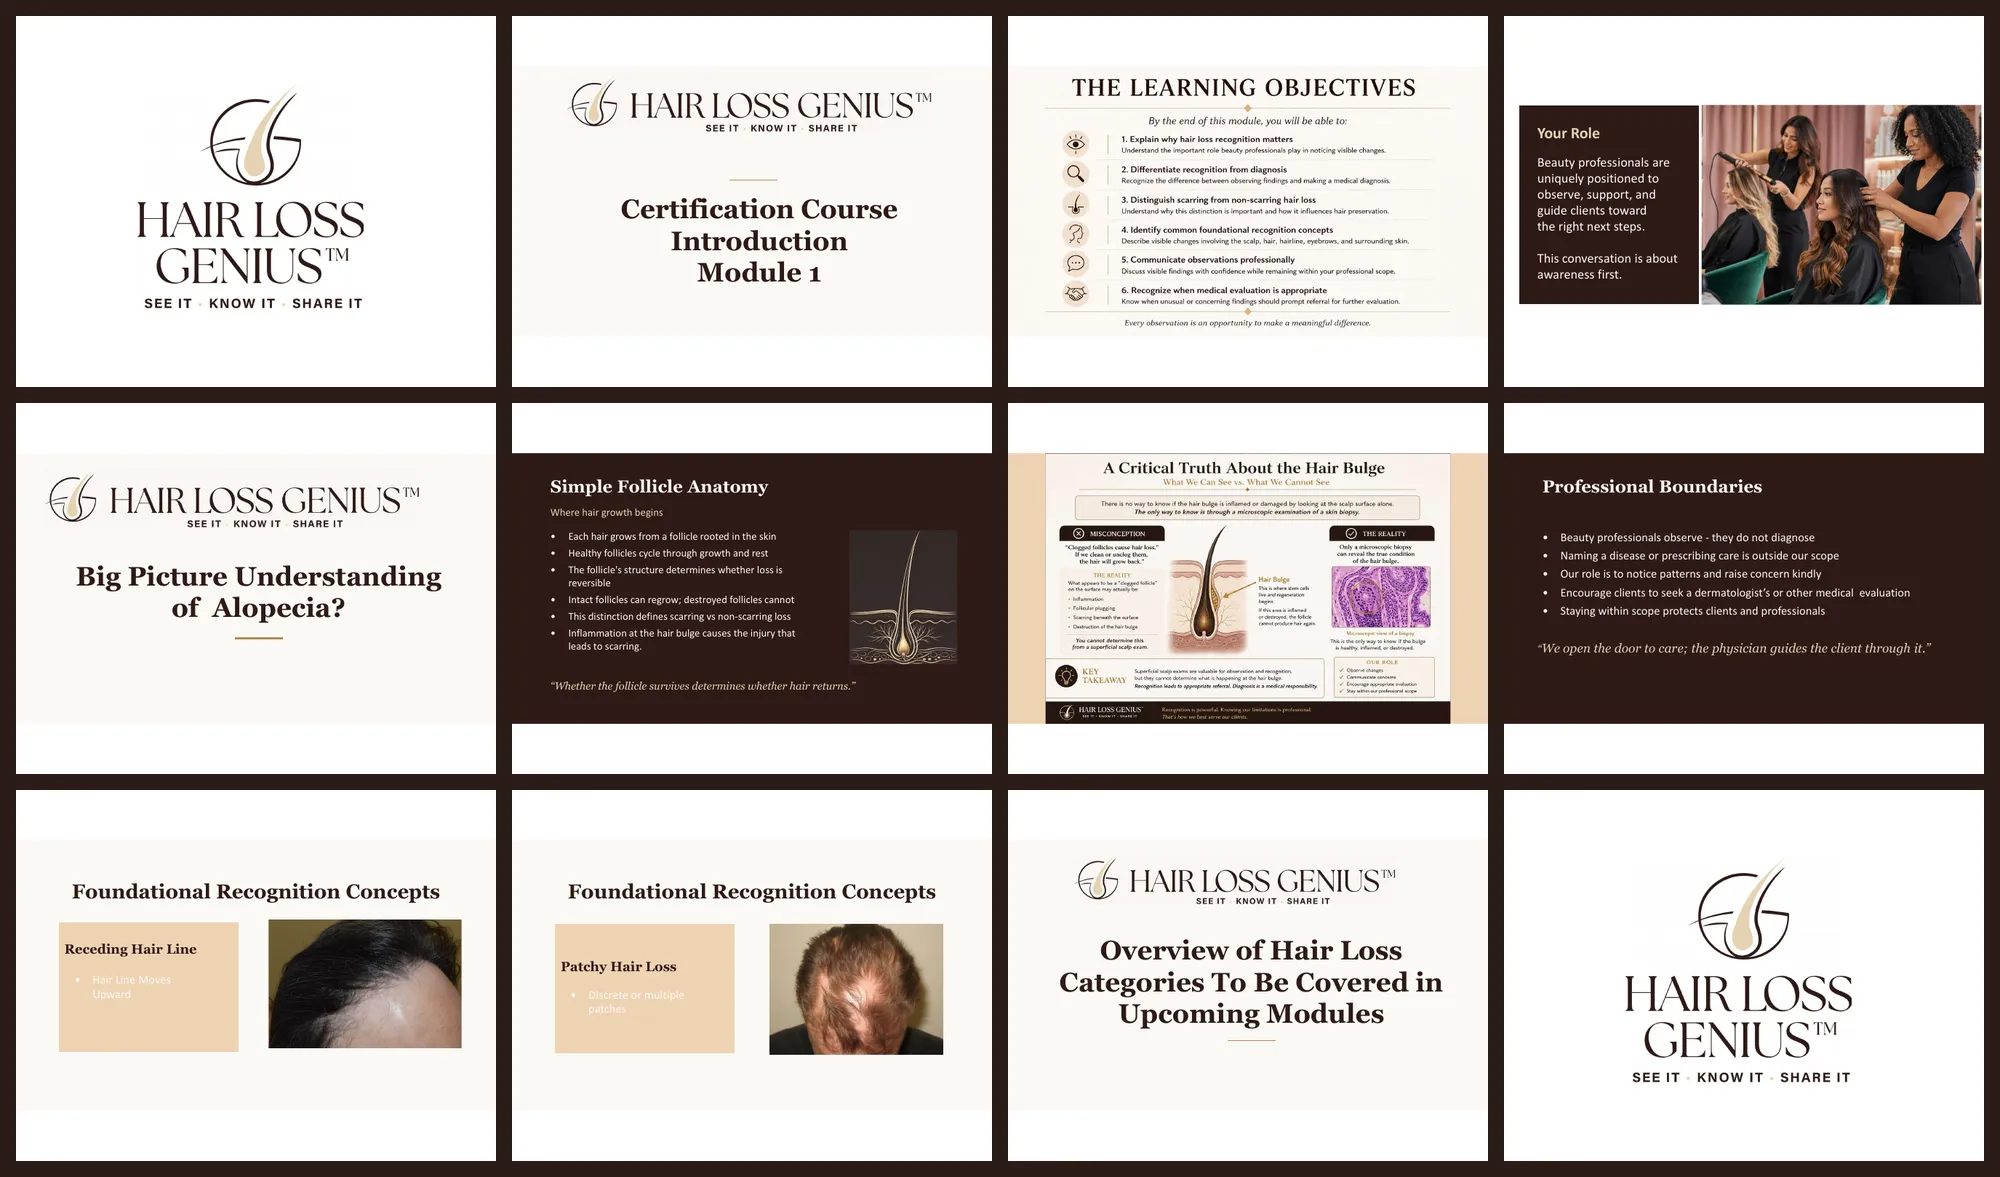
Hair Loss Genius™ Certification Course, Module 1. We turned a 57-slide designer brief into a learner workbook that students can print, write in and keep, and we designed it in two directions so the client could choose.
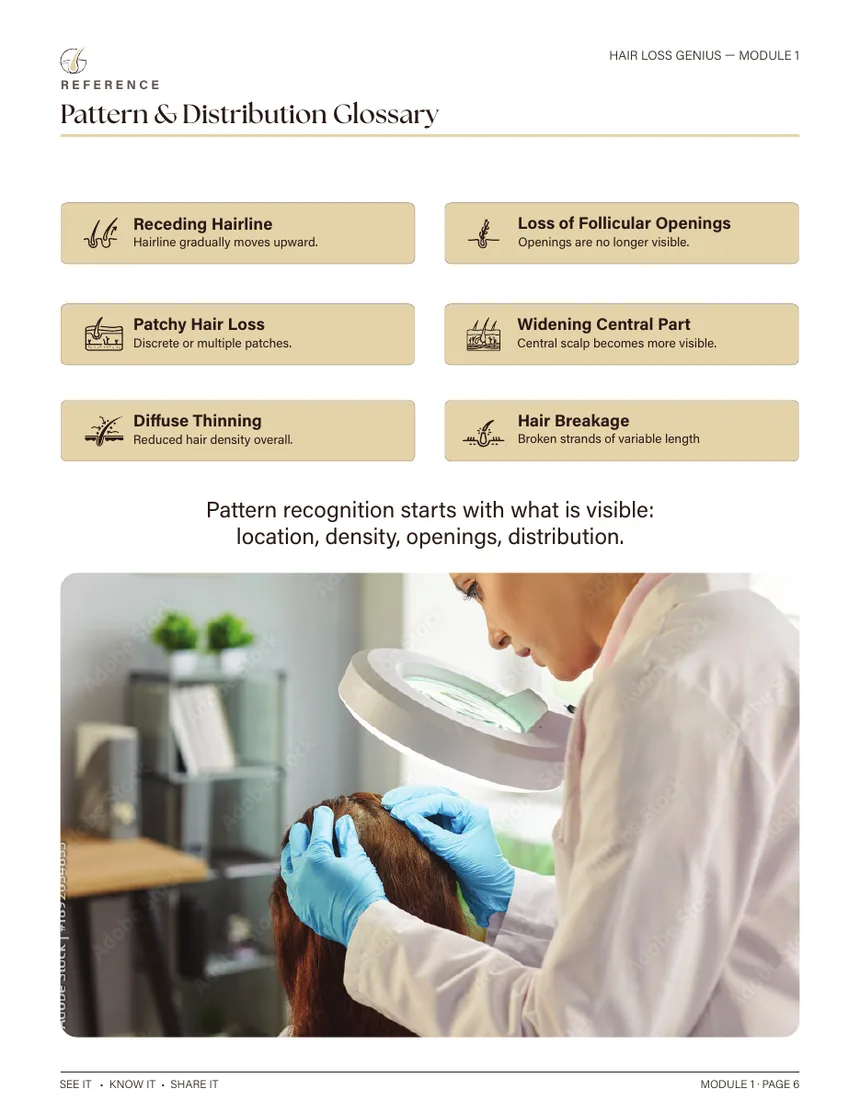
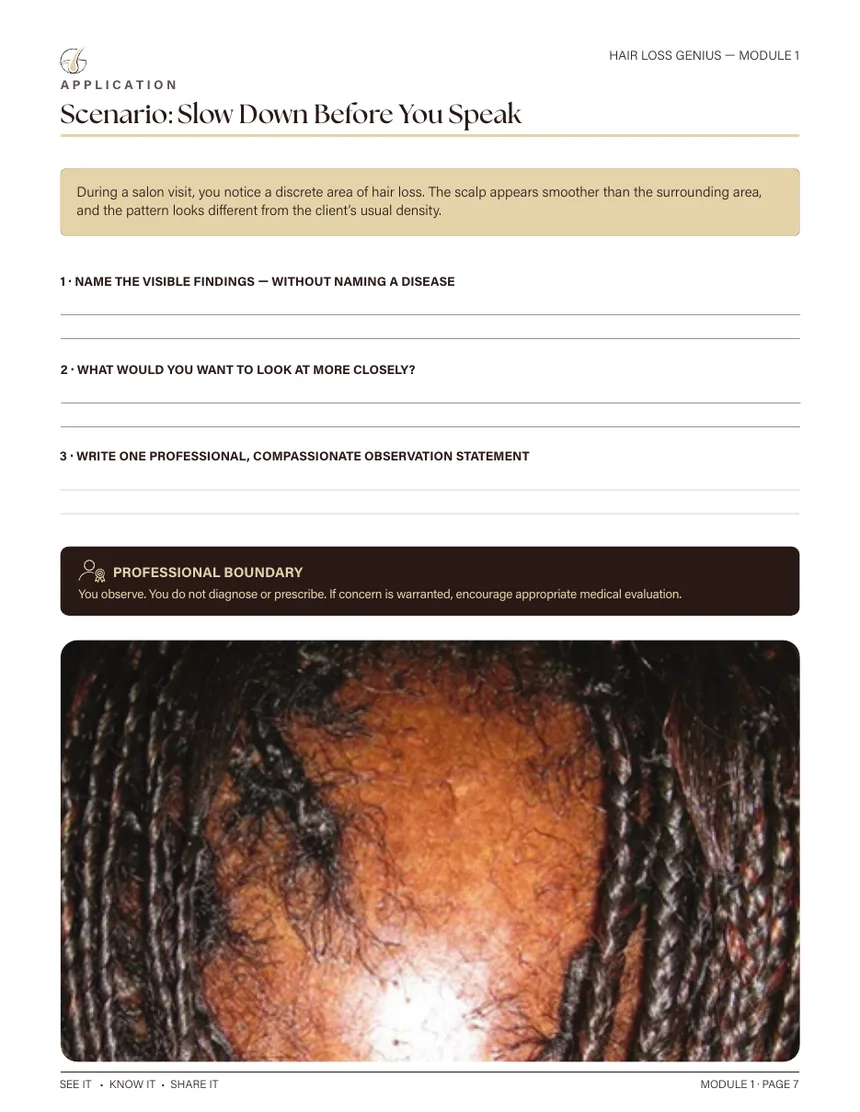
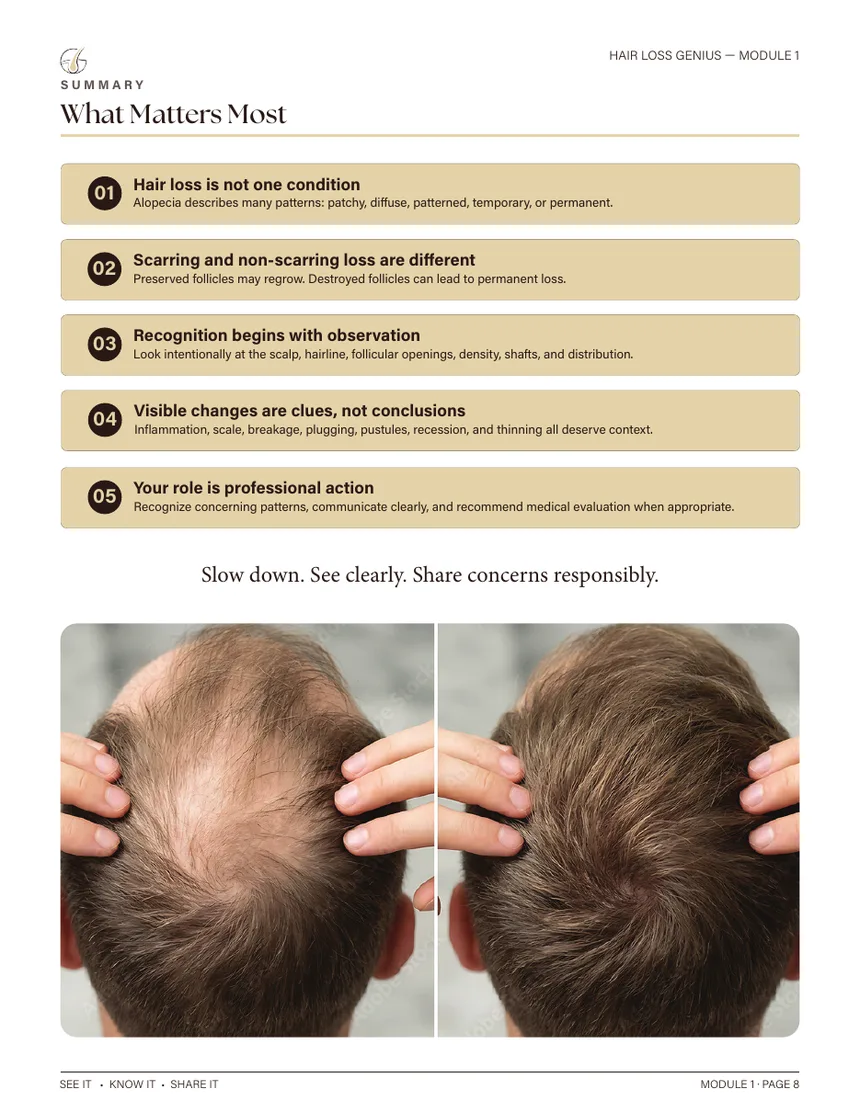
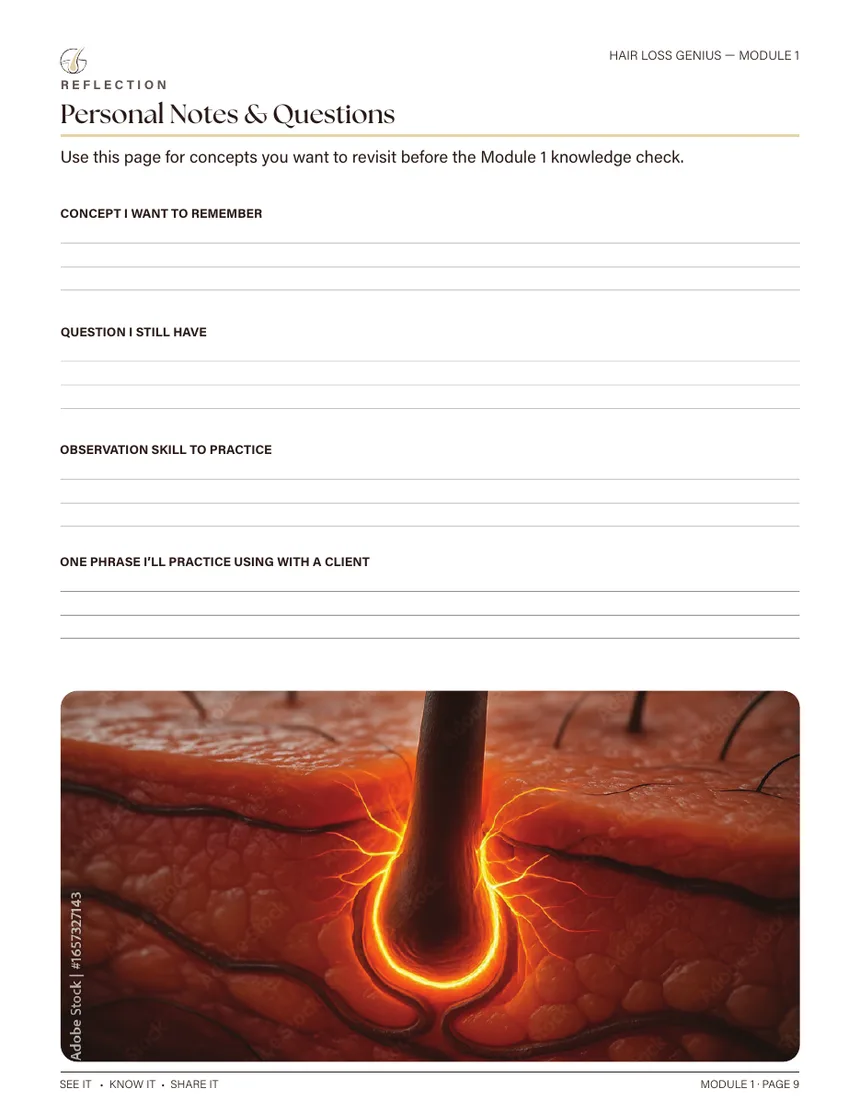
The brief arrived as a long slide deck: clinical definitions, recognition checklists, photo references and exercises. Our job was to give it a clear learning rhythm. Each page teaches one idea, adds a visual cue, then asks the learner to observe, note or check what they have learned. The brand line, See it · Know it · Share it, sets the pace from the cover to the final recognition check.
Dark chocolate and gold
A premium, editorial direction. Deep brown pages, gold rules and serif headlines give the course the feel of a professional certification.
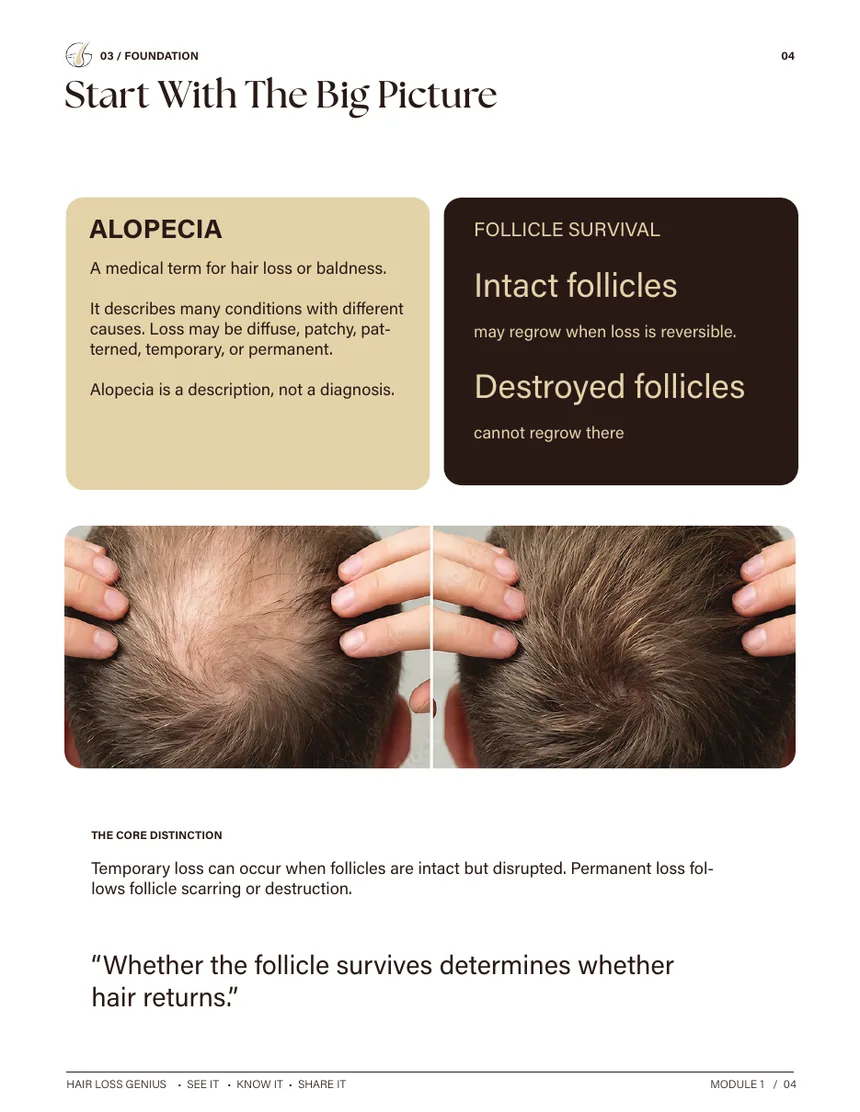
Light cream and beige
A brighter, more practical direction. Cream pages, beige panels and generous writing space make it easy to print and use during training.
Structure
We grouped 57 slides into a clear path: concepts, observation, exercises, scenario and a final check.
System
One grid, numbered scan cards, callout panels and a running footer keep every page consistent.
Use
Lined notes, learner fields and checkboxes turn the material into a workbook people actually fill in.